Chevron (CVX) Stock: Refining Carried Q3 as Brent Fell
Contents
- Chevron (NYSE: CVX) reported third-quarter 2026 adjusted earnings of $10.36 billion, $1.62 billion below the second quarter, -13.5%. Most of that gap is an accounting swing the company calls timing effects, which went from a $1.54 billion benefit in Q2 to a $1.58 billion drag in Q3. Strip them out and adjusted earnings rose from $10.44 billion to $11.94 billion, +14.4%, in a quarter when Brent averaged $97 instead of $104. The extra profit came from refining.
- Chevron is a Houston-based integrated oil company. Its upstream business finds and produces crude oil and natural gas, and its downstream business refines crude into gasoline, diesel and jet fuel, markets fuels and makes chemicals. At the $235.52 close on results day and 1.951 billion shares outstanding at the end of September, the company is worth about $459.5 billion. Q3 net income on a GAAP basis was $9.92 billion, 2.8 times the $3.54 billion of a year earlier.
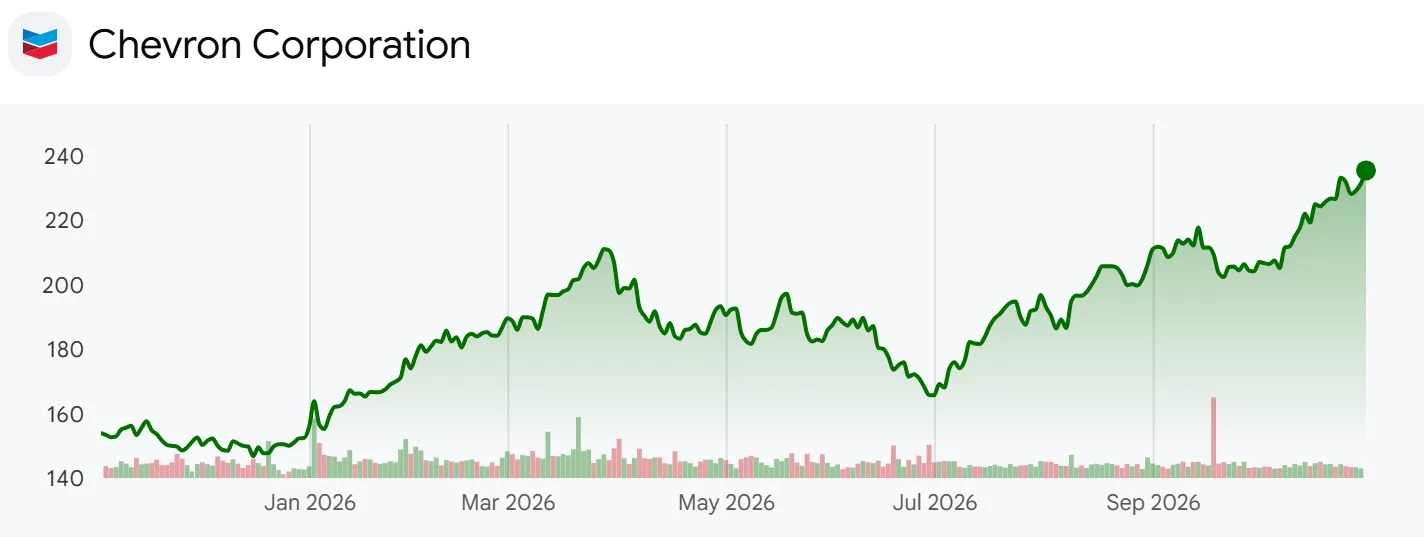
- The question here is how long the refining margins that carried the third quarter can last. The analysis lines up the Q3 2026 earnings release, the Q1 2026 earnings release where timing effects were first explained, the 29-page Q3 earnings presentation, the August sensitivities and guidance sheet, the 2025 10-K and 32 earnings releases going back to 2019.
- Two caveats apply. The figures come from the earnings release, and the Q3 10-Q notes are not included. Timing effects are a company-defined category rather than an audited line item, and the per-barrel refining figure below divides US downstream earnings by crude throughput, so it also contains chemicals, marketing and renewable fuels.
What the Q3 Slides Say About Timing Effects
- Slide 9 walks from Q2 earnings of $12.07 billion to Q3’s $9.92 billion in 15 bars. Special items took $438 million and currency $94 million, and the rest is split into upstream, downstream and other. The two longest negative bars are upstream timing effects of $1.72 billion and downstream timing effects of $1.41 billion. The longest positive bar is downstream margins at +$1.24 billion.
- Company disclosure (Q3 earnings presentation, October 30, 2026): Chevron said adjusted third-quarter earnings were $1.6 billion lower than the prior quarter. It attributed the upstream decline to lower realizations, lower liftings and unfavorable timing effects, and said downstream rose on higher refining margins and volumes that more than offset unfavorable timing effects.
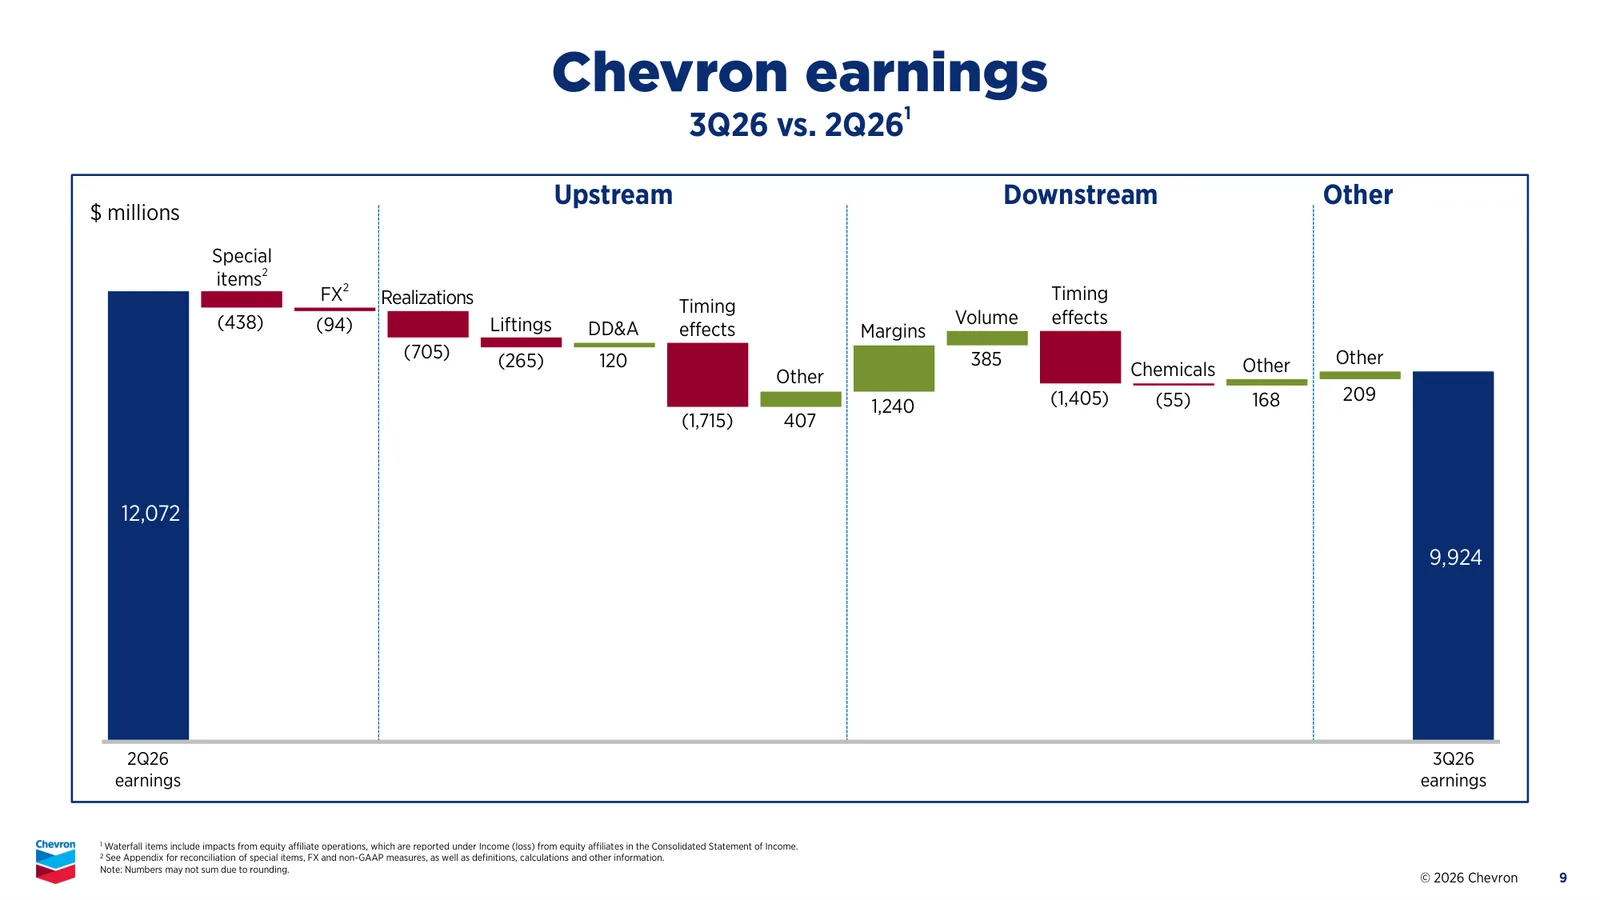
- Own calculation (slide 9): The two timing bars add up to -$3.12 billion, close to twice the $1.62 billion fall in adjusted earnings. Take timing out and the remaining bars sum to -$443 million for upstream, +$1.74 billion for downstream and +$209 million for other, a net gain of $1.50 billion. Downstream alone improved $234 million more than the whole company.
- Appendix slides 16 to 19 break timing effects out by segment. In Q3 international upstream booked -$1.05 billion and international downstream -$358 million; in Q2 the same two segments had +$742 million and +$887 million. On the US downstream bridge, margins alone added $1.23 billion.
- Slide 15 runs the same walk against Q3 2025, from $3.54 billion to $9.92 billion. The upstream realizations bar is +$3.73 billion and the downstream margins bar +$3.66 billion, nearly the same length, while timing effects cost $1.14 billion in upstream and $590 million in downstream. Over the year, higher oil prices and wider refining margins each added about the same amount.
- Slide 8 summarizes the quarter: return on capital employed (ROCE) of 17.7%, or 18.4% adjusted, organic capex of $3.9 billion, $3.5 billion in dividends and $2.5 billion of buybacks, with debt at 0.6 times and net debt at 0.4 times trailing operating cash flow. The prepared remarks add that Q4 capex should rise in line with past years while 2026 still finishes at the low end of the annual capex guidance.
Cash Flow and Entitlement Barrels in the Q3 Slides
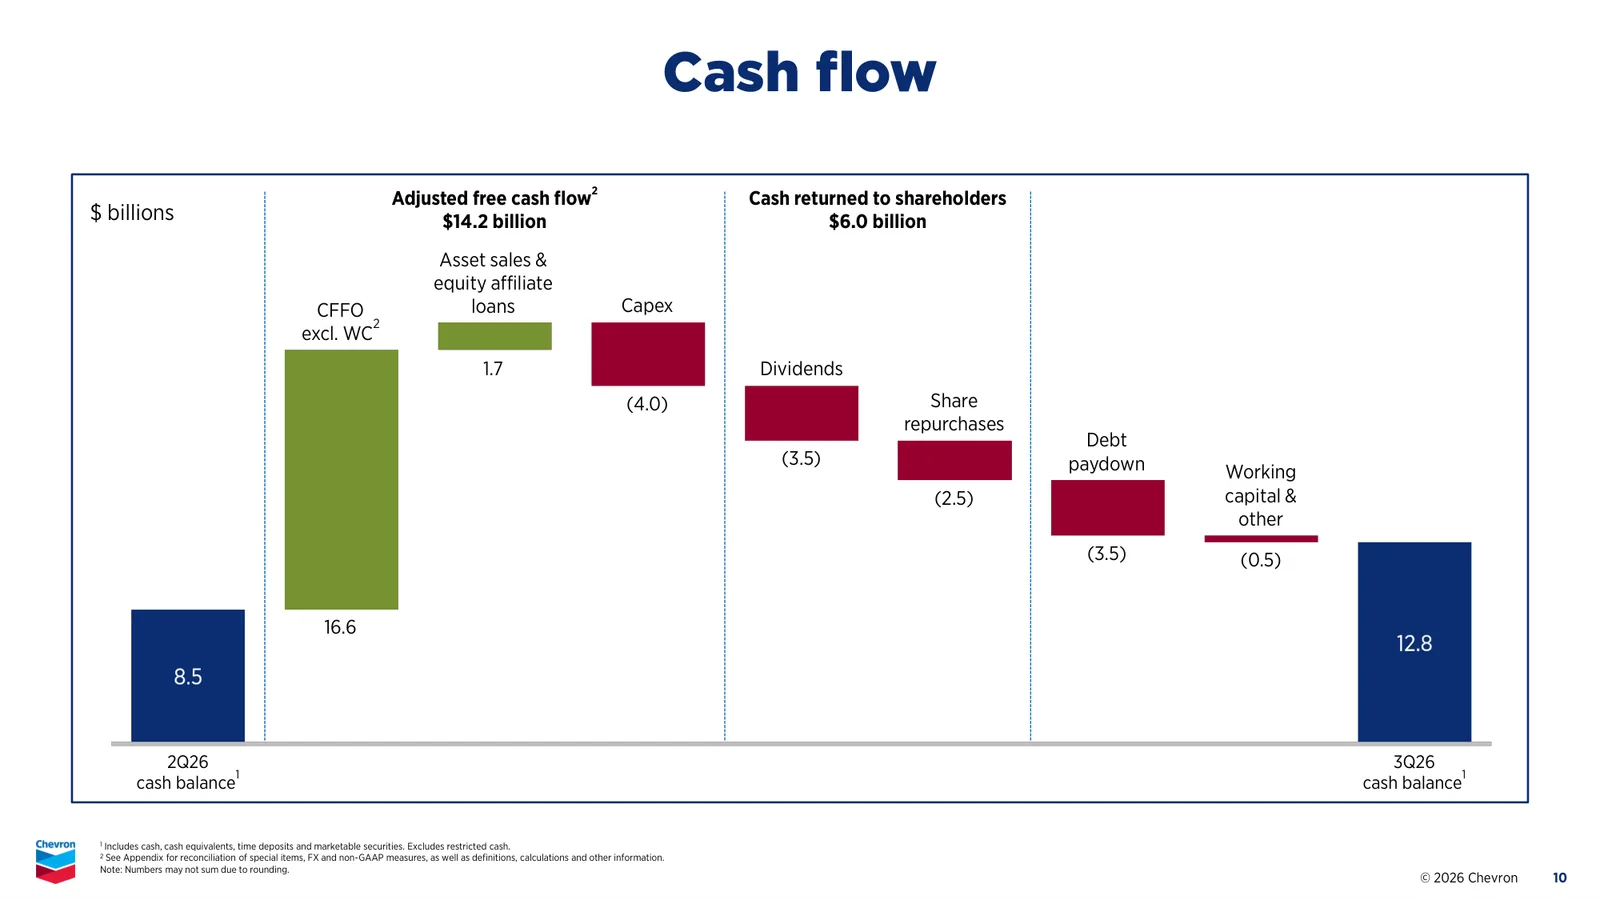
- Slide 10 starts from $16.6 billion of operating cash flow excluding working capital. Adding $1.7 billion from asset sales and affiliate loan repayments and subtracting $4.0 billion of capex gives adjusted free cash flow of $14.2 billion; after $3.5 billion of dividends, $2.5 billion of buybacks and $3.5 billion of debt repayment, cash rose from $8.5 billion to $12.8 billion. The company noted that sharp commodity price increases late in the quarter hurt working capital.
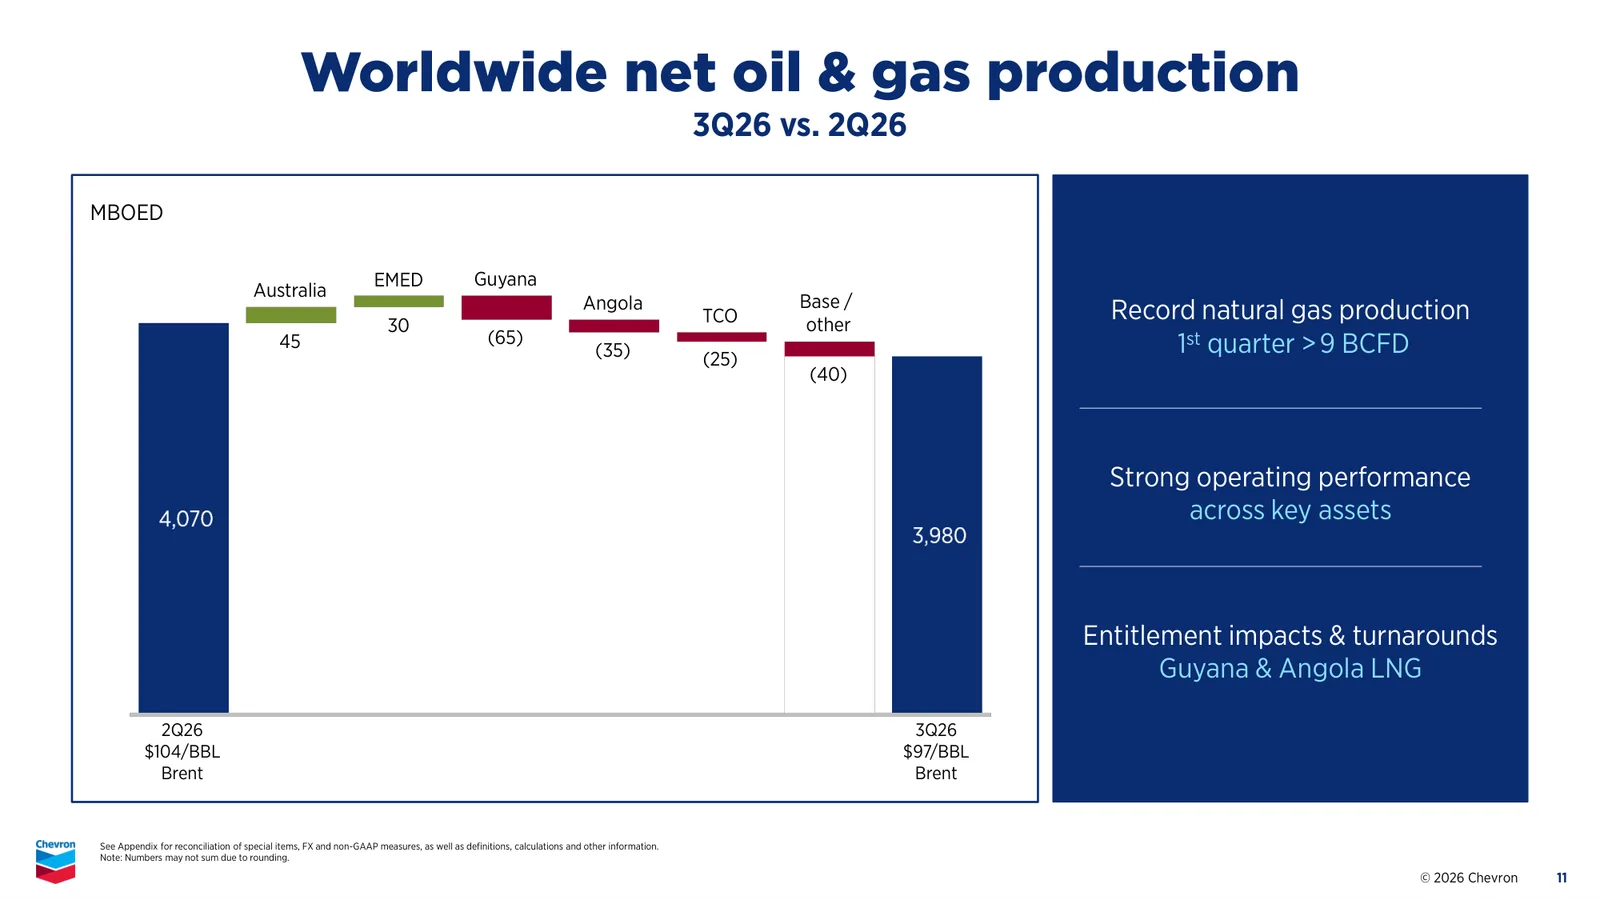
- Slide 11 bridges production from 4.07 million barrels of oil equivalent per day to 3.98 million. Australia added 45,000 barrels a day and the Eastern Mediterranean 30,000, while Guyana fell 65,000, Angola 35,000 and Tengizchevroil (TCO) in Kazakhstan 25,000. The panel on the right blames entitlement impacts and turnarounds. Under production sharing contracts, a higher oil price means fewer barrels are needed to recover costs, so the company’s share shrinks.
- Own calculation (August sensitivities and guidance): Chevron set 2026 production guidance of 3.98 million to 4.10 million barrels a day at $60 Brent and said each $10 change in Brent moves full-year output by about 15,000 barrels a day. Nine-month Brent averaged $94, $34 above that assumption, worth roughly 51,000 barrels a day. Adding that back to the nine-month average of 3.97 million gives about 4.02 million, inside the guidance range.
- Slide 6 collects capacity added by debottlenecking existing plants rather than building new ones: more than 85,000 barrels a day upstream and 20,000 barrels a day in refining, plus a 20% increase at TCO’s Third-Generation Plant that takes total processing to slightly over 1 million barrels a day. Yet TCO production fell 25,000 barrels a day on slide 11, so the added capacity did not yet show up in Q3 volumes. The company only said TCO has run near full rates in recent months. At Pasadena the slide claims a refinery capacity gain of about 15% at nominal cost, and the 10-K shows Pasadena throughput rising from 65,000 barrels a day in 2024 to 110,000 in 2025.
The Bull and Bear Case for Chevron Shares
- The bull case rests on earnings before timing effects. In a quarter when Brent was -6.7%, adjusted earnings excluding timing rose +14.4%, and US refineries ran a record 1.093 million barrels a day. The company describes the -$2.98 billion of nine-month timing effects as a lag that unwinds when prices fall.
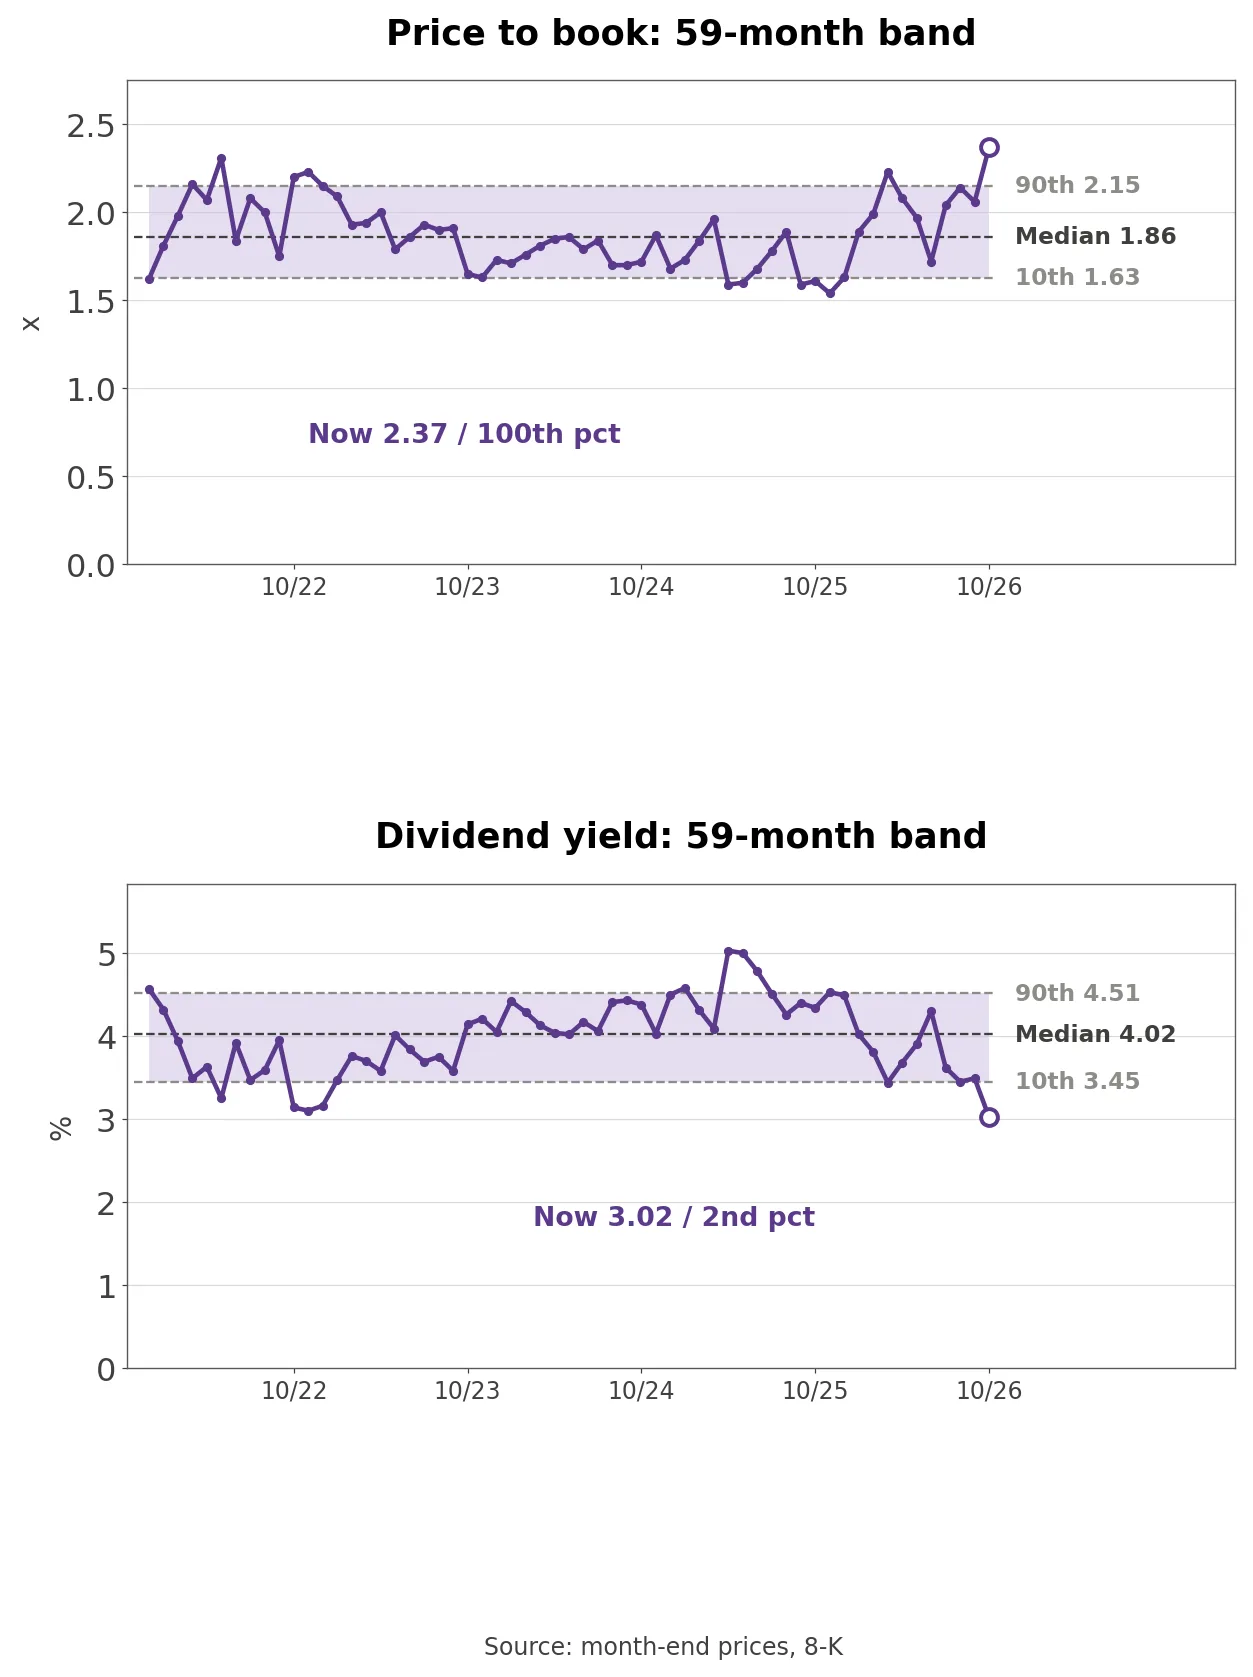
- The bear case rests on where that profit came from. The $4.93 billion of downstream earnings was earned in what management calls “a supply-constrained market”, and upstream production was -2.6% year over year because higher prices cut entitlement barrels. Price to book of 2.37 times is the highest in the 59 months since December 2021.
From Noble Energy to Hess and Venezuela
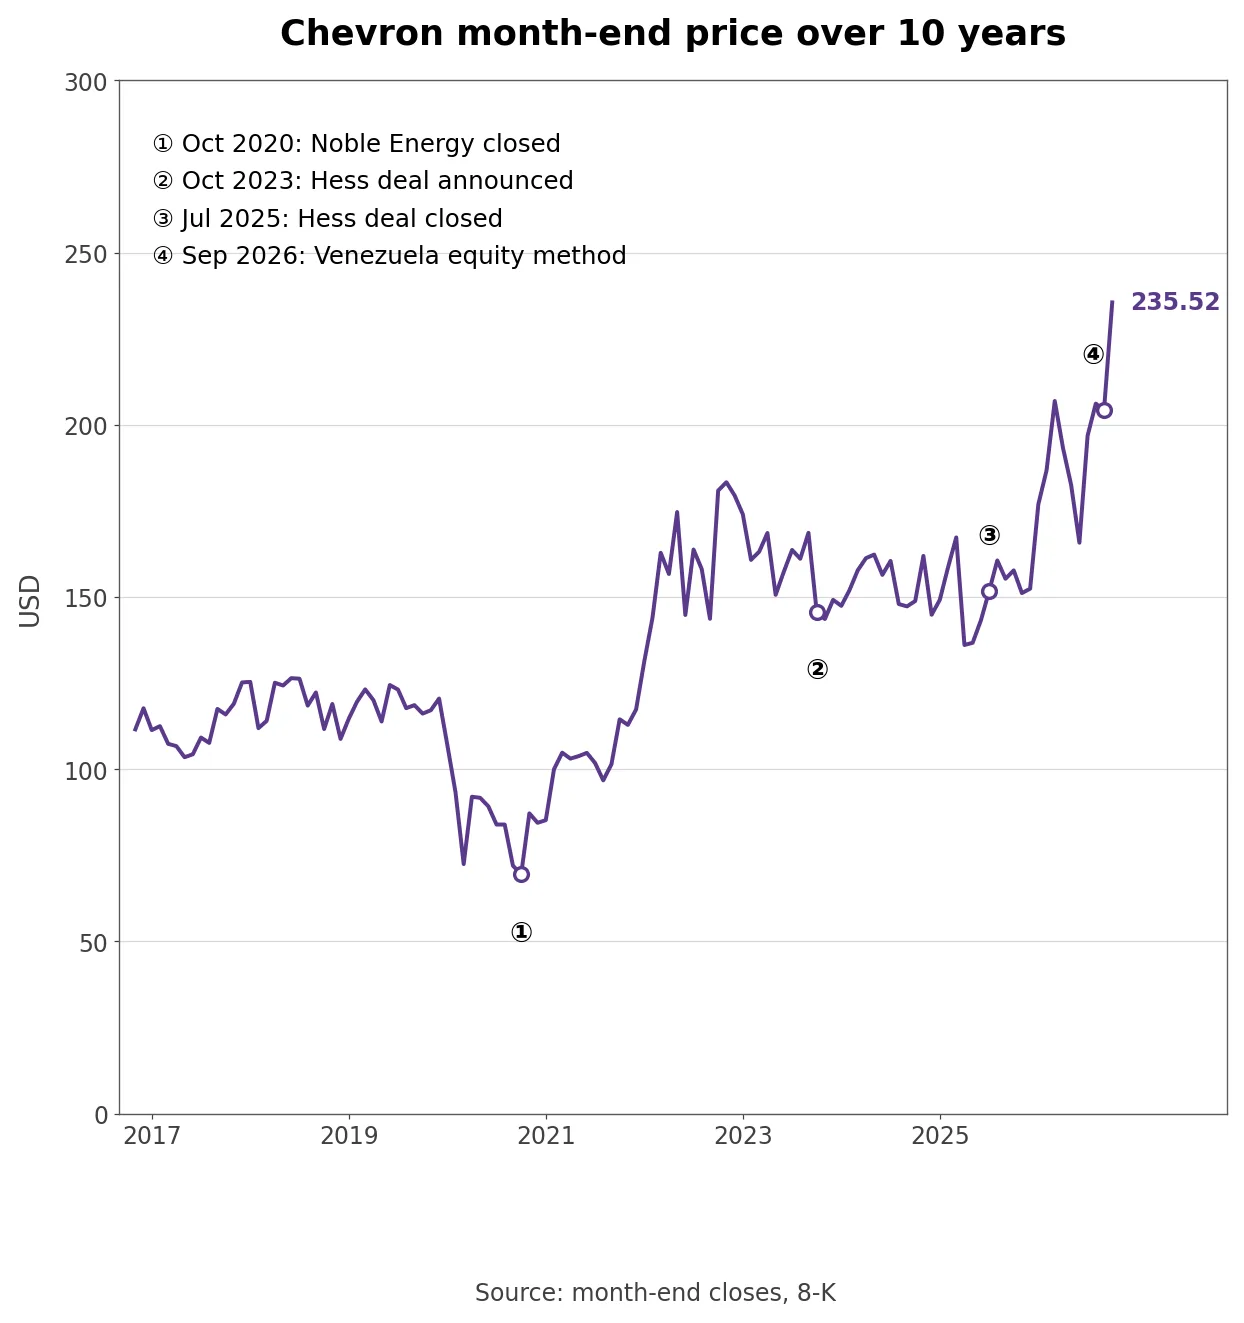
- In Q2 2019 Chevron booked $740 million of earnings from the Anadarko merger termination fee. In Q2 2020 it lost $8.27 billion as, in its own words, “The economic impact of the response to COVID-19 significantly reduced demand for our products and lowered commodity prices”. It closed the Noble Energy acquisition that October, adding Eastern Mediterranean gas, the DJ Basin in Colorado and more Permian acreage, and the $69.50 month-end close that month is the lowest in 10 years.
- In Q2 2022 Chevron earned $11.62 billion with $3.52 billion from downstream, the largest downstream result since at least Q4 2018 until Q2 2026. In October 2023 it completed the PDC Energy acquisition and announced the Hess deal, which brought a 30% stake in Guyana’s Stabroek block plus Bakken and Gulf of America assets. The Hess deal closed in July 2025; the quarterly weighted share count went from 1.719 billion to 1.939 billion and book value per share from $85.17 at the end of June to $97.91 at the end of September.
- On September 1, 2026 Chevron switched its Venezuelan joint ventures to equity accounting, so Q3 production includes only one month of them. The stock went from $152.41 at the end of 2025 to $235.52, +54.5%, the highest month-end close in a decade.
Adjusted Earnings Without Timing Effects
- Among 32 earnings releases since 2019, the words timing effects first appear in the Q1 2026 release. Chevron described them as mismatches between earnings recognition on financial derivatives marked to market before the physical crude or products are delivered, together with “the impact of LIFO inventory accounting”. The Q3 presentation says more timing effects arise while prices rise and they unwind when prices fall.
- Own calculation (four quarters of earnings releases): Q1 adjusted earnings of $2.79 billion included about -$2.94 billion of timing effects, so earnings before timing were $5.73 billion. The same calculation gives $10.44 billion for Q2 and $11.94 billion for Q3, three straight quarterly increases. Nine-month timing effects total -$2.98 billion against +$200 million in the first nine months of 2025.
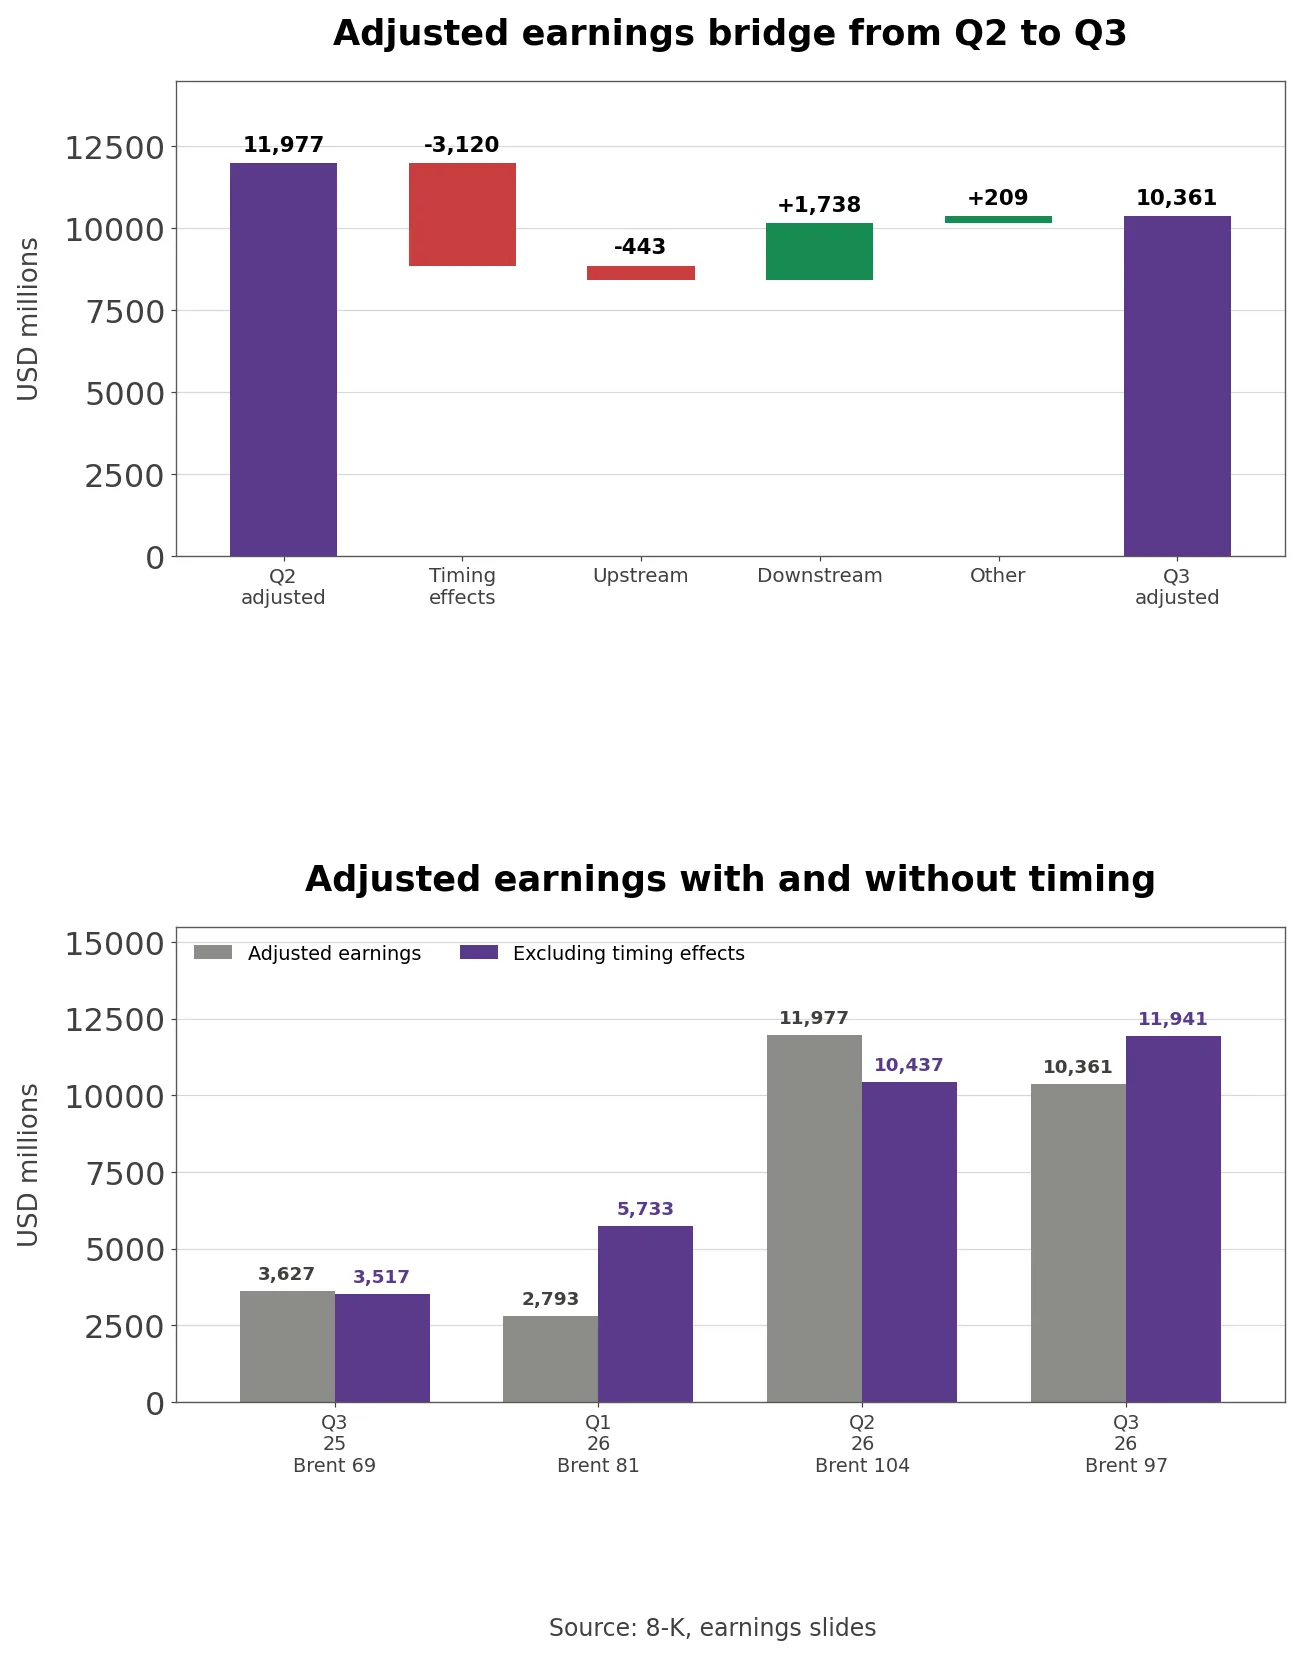
- Against a year earlier the gap is wider. Earnings before timing were $3.52 billion in Q3 2025 and rose 3.4 times in a year while Brent moved from $69 to $97. Chevron’s August sheet puts full-year after-tax sensitivity at about $600 million per $1 of Brent, or $150 million a quarter. A $7 lower Brent from Q2 to Q3 would suggest about $1.05 billion less, but the realizations bar on slide 9 was only -$705 million. The sheet notes that contract LNG prices follow Brent with a three-to-four-month lag, and international gas realizations rose from $7.84 to $9.44 per thousand cubic feet.
How Much Does Chevron Earn per Barrel It Refines?
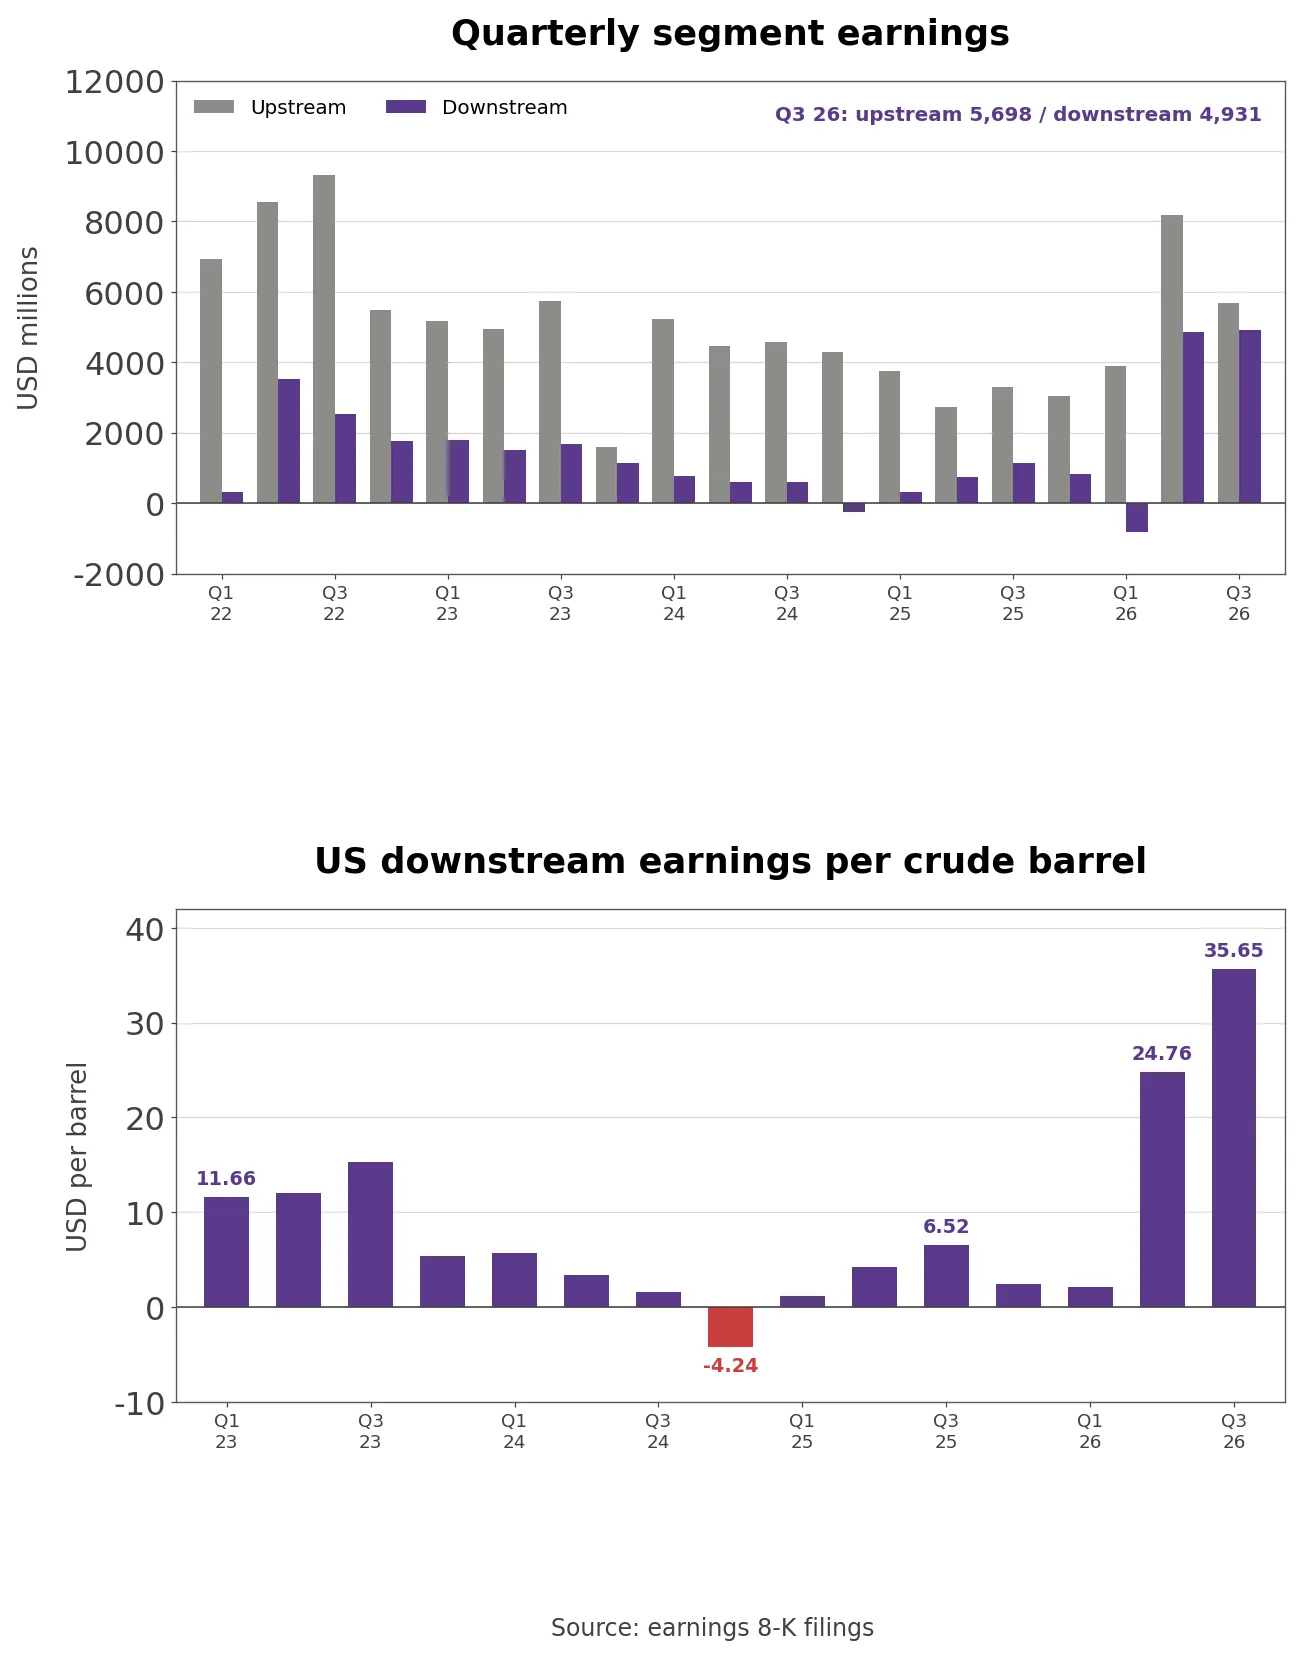
- Q3 downstream earnings of $4.93 billion are the highest in 32 quarters since Q4 2018, with $3.59 billion from the US. The previous US high was $2.44 billion in Q2 2022. Downstream was 46.4% of combined upstream and downstream earnings in Q3, compared with 25.6% a year earlier.
- Own calculation (15 quarters of earnings releases): Dividing US downstream earnings by crude throughput times days in the quarter gives $35.65 per barrel in Q3, $24.76 in Q2 and $6.52 a year earlier. The figure went from $11.66 in Q1 2023 to -$4.24 in Q4 2024 and from $2.07 in Q1 2026 to 17 times that level two quarters later. Throughput of 1.093 million barrels a day was +2.7% year over year, so most of the gain came from margin per barrel.
- With US refineries running at nearly 98% utilization, extra volume has to come from debottlenecking, and the company plans another 7% at Pascagoula by 2030. International refinery runs rose to 665,000 barrels a day from 598,000 in Q2, but international product sales were -9% year over year because of “supply disruptions from the Middle East conflict”.
- Cash followed the earnings. Q3 free cash flow (FCF, operating cash flow minus capex) was $12.0 billion, and dividends of $3.48 billion plus buybacks of $2.50 billion returned $5.98 billion, a 49.9% payout of FCF. Over nine months Chevron returned 65.5% of $28.55 billion in FCF, net debt fell from $34.46 billion at the end of 2025 to $20.73 billion, and net debt to trailing operating cash flow went from 1.0 to 0.4 times.
How Chevron Makes Money From Oil Fields and Refineries
- Upstream produced 3.98 million barrels of oil equivalent a day in Q3, roughly half in the US (2.04 million) and half abroad (1.94 million). Per the 2025 10-K, 43% of proved reserves are in the US, 15% in Australia and 11% in Kazakhstan.
- The Permian Basin anchors US output and has topped 1 million barrels a day for six straight quarters. The DJ Basin from Noble and PDC, the Bakken from Hess and the deepwater Gulf of America, where Anchor, Ballymore and Whale have ramped up, fill out the rest. Abroad the main pillars are the 50%-owned TCO, the operated Gorgon (47.3%) and Wheatstone LNG projects in Australia, and the 39.7%-owned and operated Leviathan gas field in Israel.
- Guyana’s Stabroek block, 30% owned since Hess, is the growth asset. The 10-K says the fourth floating production vessel, One Guyana, started up in August 2025 with capacity of about 250,000 gross barrels a day, and the January 2026 release recorded the investment decision on Hammerhead, the seventh development. The August guidance sheet also warns that cost recovery in Guyana reduces net entitlement as it progresses, the same direction as the 65,000-barrel drop on slide 11.
- Upstream profit follows prices. The August sheet puts full-year sensitivity at about $600 million per $1 of Brent and about $700 million per $1 of Henry Hub gas. In Q3 US liquids realized $62.72 a barrel, international liquids $86.09, and US natural gas $1.88 per thousand cubic feet.
- Downstream refines crude and sells fuels and chemicals. The five US refineries are Pascagoula in Mississippi (369,000 barrels a day), El Segundo (290,000) and Richmond (257,000) in California, Pasadena in Texas (125,000) and Salt Lake City in Utah (58,000), with operable capacity of 1.099 million barrels a day at the end of 2025. Slide 5 adds that more than 80% of US refinery turnarounds in the last two years were completed in first-quartile duration.
- Outside the US Chevron owns 60.6% of the Map Ta Phut refinery in Thailand and half of two joint-venture refineries: GS Caltex’s Yeosu refinery in South Korea, with 800,000 barrels a day of total capacity and described in the 10-K as one of the world’s largest, and the 290,000-barrel Singapore refinery. Chemicals sit in the 50%-owned Chevron Phillips Chemical, and 11 biofuel plants in the US and Germany make renewable diesel and biodiesel.
- International downstream earned $1.35 billion in Q3, 2.7 times the $499 million of a year earlier, even as international product sales fell. The company put it down to higher margins on refined product sales.
- TCO shows up in cash flow too. Chevron said operating cash flow rose partly on increased cash distributions from TCO, and adjusted FCF includes a $1 billion TCO loan repayment. Capex of $4.01 billion included $1.67 billion of US upstream spending, down from $2.38 billion a year earlier on lower Permian spend, and the company expects to finish 2026 at the low end of its $18 billion to $19 billion organic capex range.
Venezuela’s Production Plan and Its Reserves
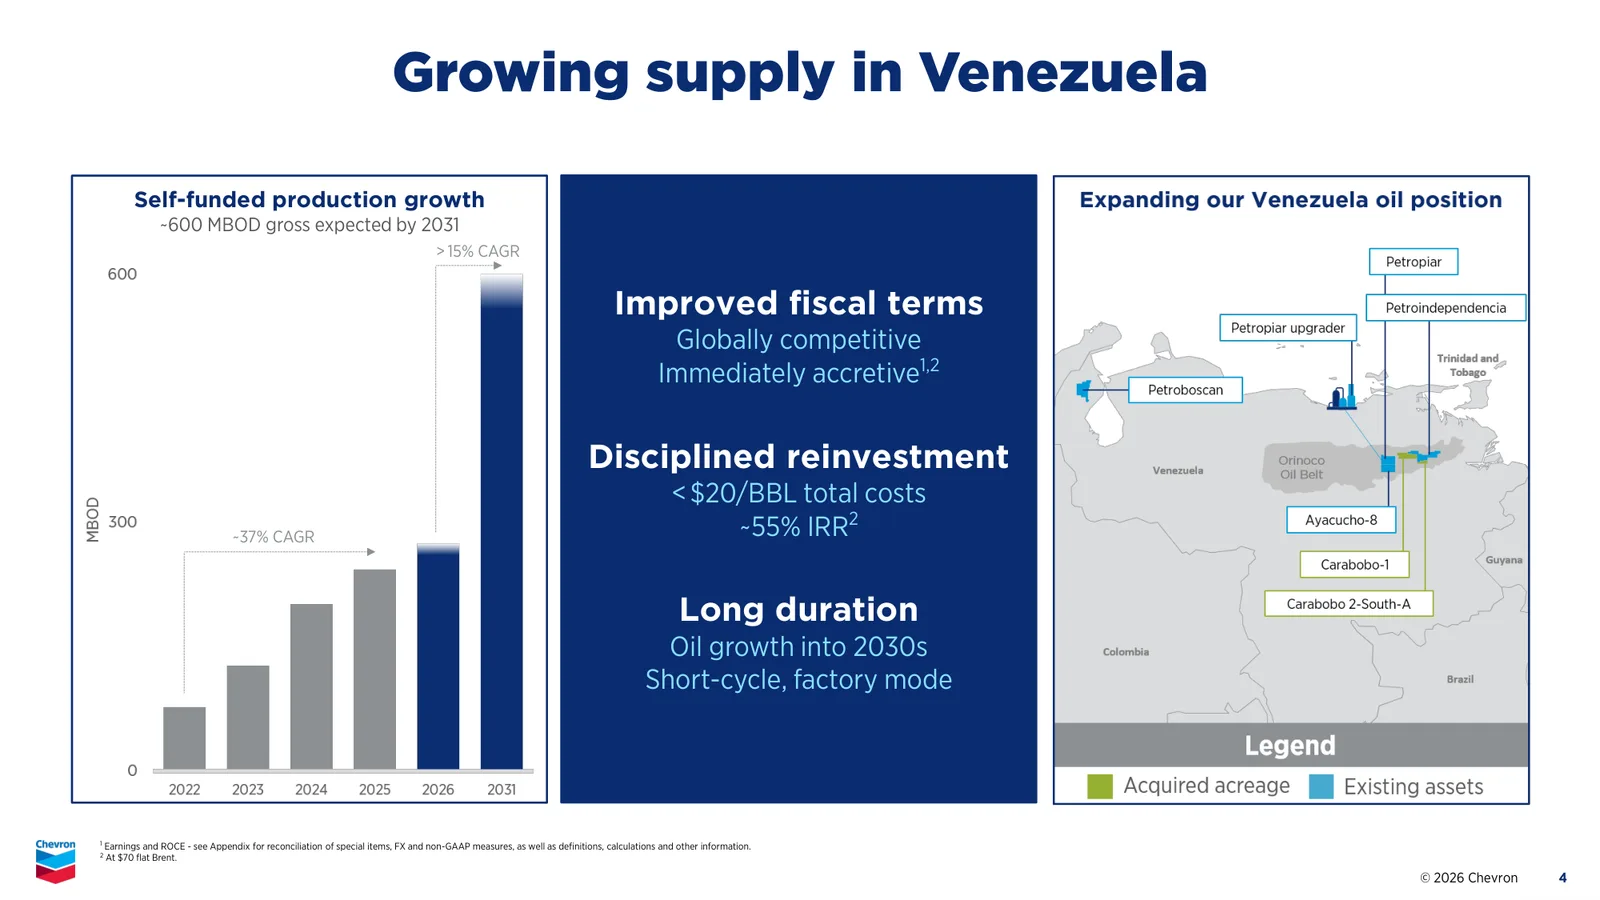
- Slide 4 shows a plan to lift gross production from Chevron’s three Venezuelan joint ventures to about 600,000 barrels of oil a day by 2031. The bars imply roughly +37% a year from 2022 to 2026 and +15% or more a year from 2026 to 2031, with total costs under $20 a barrel and an internal rate of return of about 55% at $70 flat Brent. The release says the joint ventures plan to invest $7 billion over five years, and Chevron markets all of their crude, most of it to US refineries including Pascagoula and El Segundo.
- Company disclosure (2025 Form 10-K, February 24, 2026): Chevron’s Venezuelan interests include 39.2% of Petroboscan, 30% of Petropiar and 35.8% of Petroindependencia, and “As of December 31, 2025, no proved reserves are recognized for these interests.” The company said it operated there under licenses issued by the US government.
- After the switch to equity accounting, Venezuela contributes through affiliate income and distributions rather than consolidated production. Chevron expects Q4 affiliate distributions of $3.0 billion to $3.5 billion including Venezuela, and gross joint-venture output of about 300,000 barrels a day by year end, +20% over 12 months. Whether the 600,000-barrel plan turns into booked reserves is first testable in the 2026 10-K.
How Chevron Compares With ExxonMobil Shell and TotalEnergies
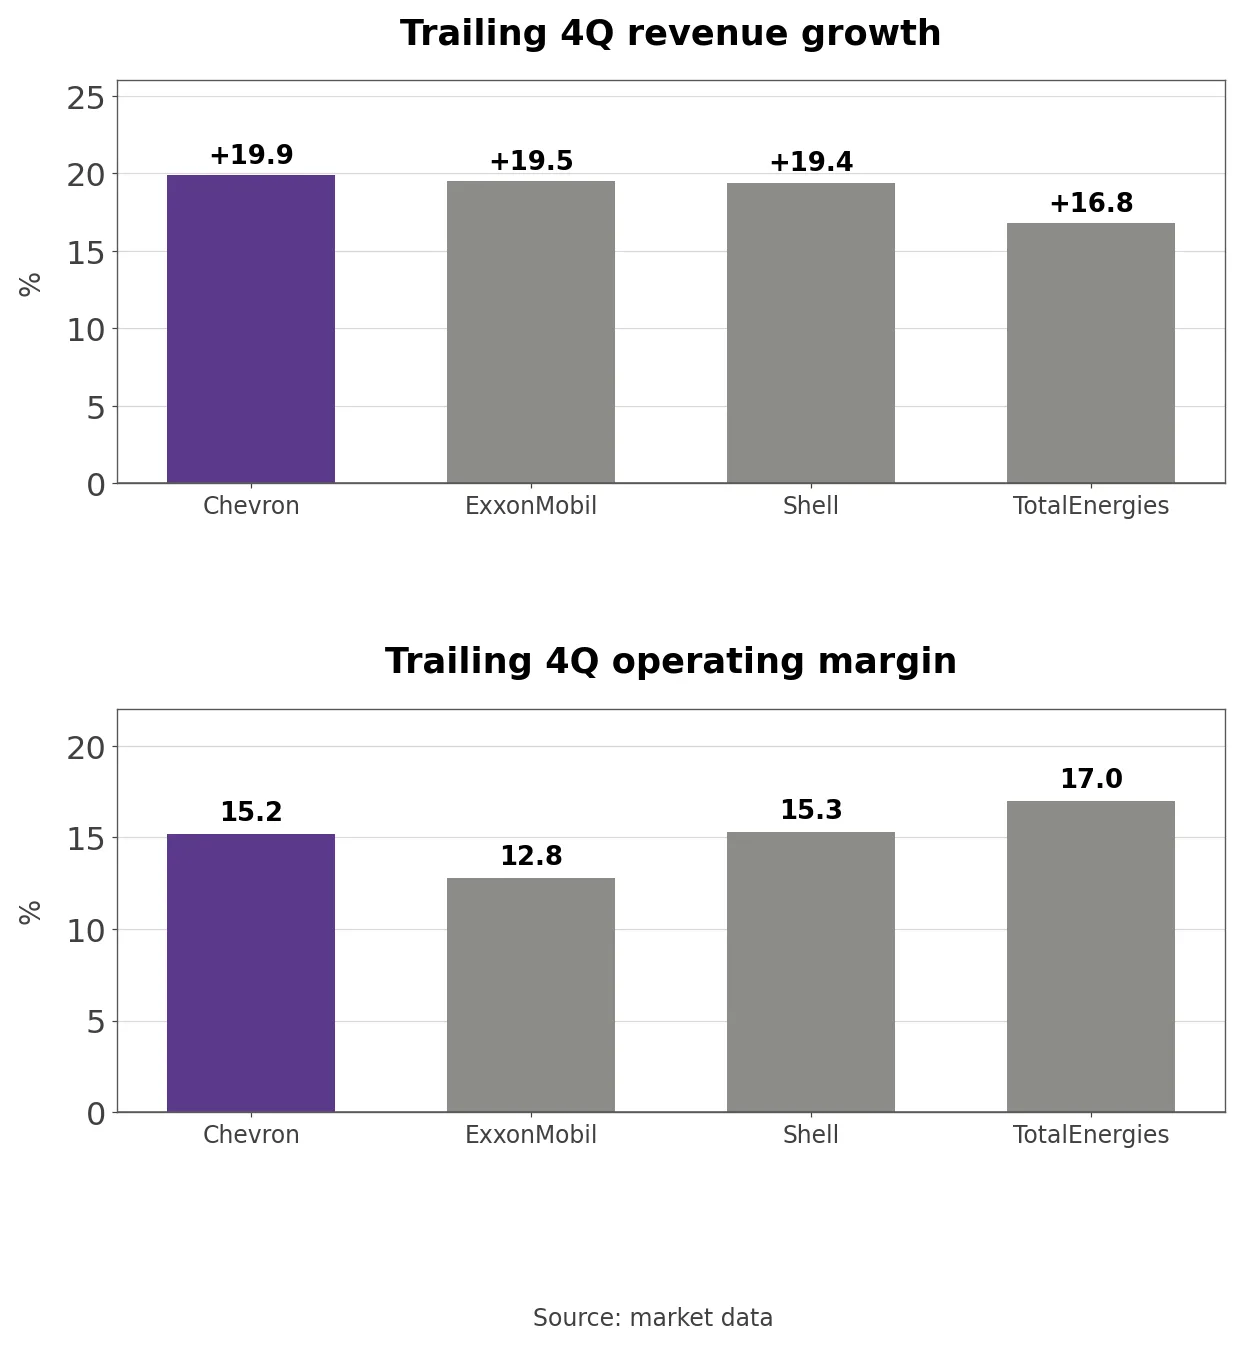
- The peers are ExxonMobil, the largest US oil company, and the European integrated majors Shell and TotalEnergies, all of which combine production with refining and chemicals. On market data, trailing four-quarter revenue growth was +19.9% at Chevron, +19.5% at ExxonMobil, +19.4% at Shell and +16.8% at TotalEnergies. Operating margin was 17.0% at TotalEnergies, 15.3% at Shell, 15.2% at Chevron and 12.8% at ExxonMobil.
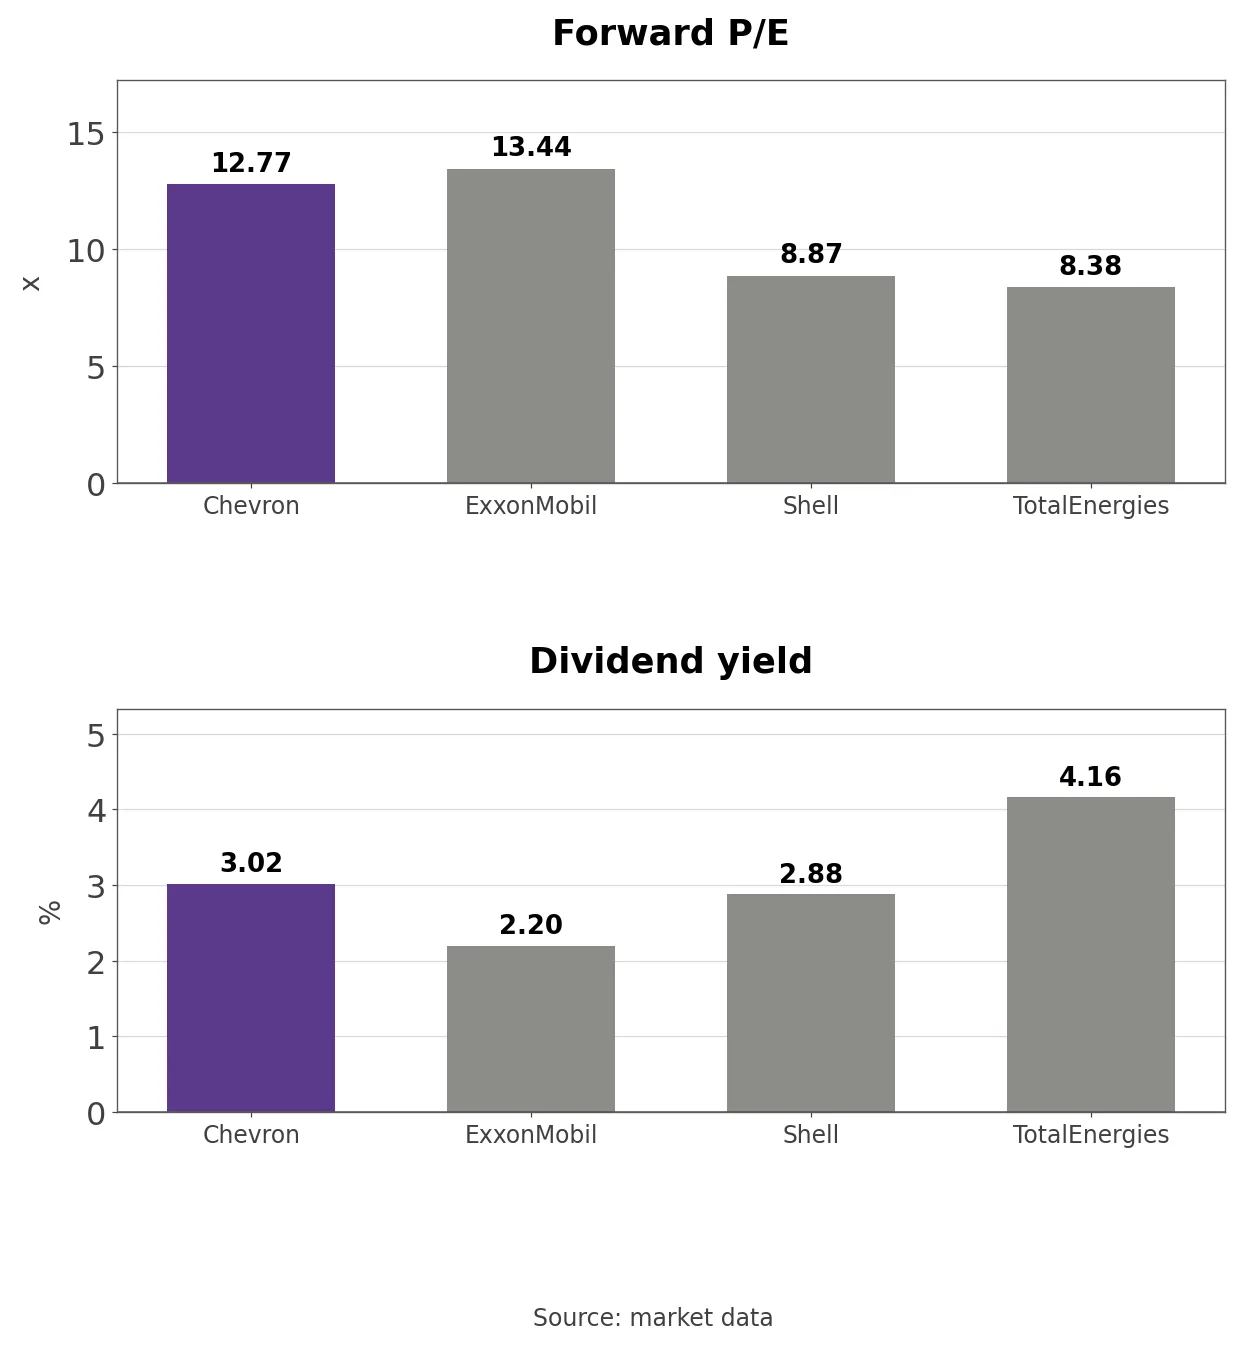
- Valuation splits along the Atlantic. Forward P/E is 13.44 at ExxonMobil, 12.77 at Chevron, 8.87 at Shell and 8.38 at TotalEnergies, and dividend yield is 4.16% at TotalEnergies, 3.02% at Chevron, 2.88% at Shell and 2.20% at ExxonMobil. Over the past year Chevron’s market value rose +71.4%, ahead of ExxonMobil’s +53.8%, TotalEnergies’ +48.3% and Shell’s +34.2%.
Chevron’s Price-to-Book and Dividend Yield Band
- Quarterly net income has swung between $2.2 billion and $12.1 billion this year, so the band uses book value and dividends instead of P/E.
- Using month-end prices and book value from 32 earnings releases, month-end price over quarter-end book value per share gives a price to book of 2.37 times, the highest of the 59 months since December 2021, above the previous high of 2.31 in May 2022 and the 1.86 median. Annualizing the $1.78 quarterly dividend gives a 3.02% yield, the lowest of the 59 months, against a 4.02% median and a 5.03% high in April 2025.
- Forward P/E on market data is 12.77. Annualizing nine-month adjusted EPS of $12.73 gives $16.97 and a multiple of 13.9 times, which assumes Q3’s refining profit carries into Q4.
Three Conditions That Move the Stock
- US downstream earnings were $3.59 billion in Q3, or $35.65 per barrel of crude. Chevron expects Q4 downstream turnarounds at Pascagoula and Richmond to cost $400 million to $500 million after tax. If the per-barrel figure returned to the 2025 average of $3.63, US downstream would earn about $365 million at Q3 throughput, roughly $3.22 billion less and equal to 31.1% of Q3 adjusted earnings.
- Timing effects stand at -$2.98 billion for nine months. A Brent average below Q3’s $97 would let some of that unwind into earnings, but the $600 million per dollar realization sensitivity works the other way. A higher Brent improves realizations and books more timing losses.
- Production was 3.98 million barrels a day in Q3, and Q4 guidance calls for 175,000 to 225,000 barrels a day of turnarounds and downtime, including a major turnaround at Wheatstone LNG, curtailment in the Partitioned Zone and October hurricane downtime in the Gulf of America. Holding the 3.98 million low end of full-year guidance and collecting $3.0 billion to $3.5 billion of affiliate distributions including Venezuela are the upstream checks.
What to Watch in the Fourth Quarter
- Q4 will carry a one-time after-tax loss of about $3 billion to $4 billion on closing the Hess Midstream transaction, treated as a special item. Chevron said it agreed to cut Bakken midstream costs by about half but cannot recognize those future savings as an asset, so GAAP net income and adjusted earnings will diverge again.
- One question stays open. The $35.65 per-barrel US refining figure was earned in what Chevron calls a supply-constrained market; once that eases, does it stay above the single digits of 2025?
Related Analysis
- Casey’s (CASY) Stock Analysis: Fuel Margin Drove Q4 Profit: a fuel retailer whose profit swung on fuel margin, useful next to Chevron’s refining margin at the other end of the same chain.
- Linde (LIN) Stock Analysis: Price, Volume and Margin Trends: another industrial company read through a price, volume and margin bridge, the same way Chevron’s slides split its earnings.