Freeport-McMoRan (FCX) Stock: Minorities Get 42% of Growth
Contents
- Freeport-McMoRan (NYSE: FCX) earned $1.17 billion for common stockholders in the third quarter of 2026, +74.2% from a year earlier, while it sold 749 million pounds of copper against 977 million, -23.3%. The realized copper price did the work: $6.54 a pound against $4.68, +39.7%. Management now points to Grasberg’s recovery for copper sales growth of 23% in 2027 and 11% in 2028, but a footnote on slide 7 of the call deck shows that 460 million of the 1.1 billion extra consolidated pounds between 2026 and 2028, or 41.8%, belong to noncontrolling interests rather than to FCX shareholders.
- Freeport mines copper, gold and molybdenum in Arizona and New Mexico, Peru and Chile, and at the Grasberg district in Indonesia, and is one of the largest listed copper producers in the world. At $66.60 a share it is worth $95.6 billion. The stock is +31.1% in 2026 on month-end closes but -12.1% below its August high of $75.74.
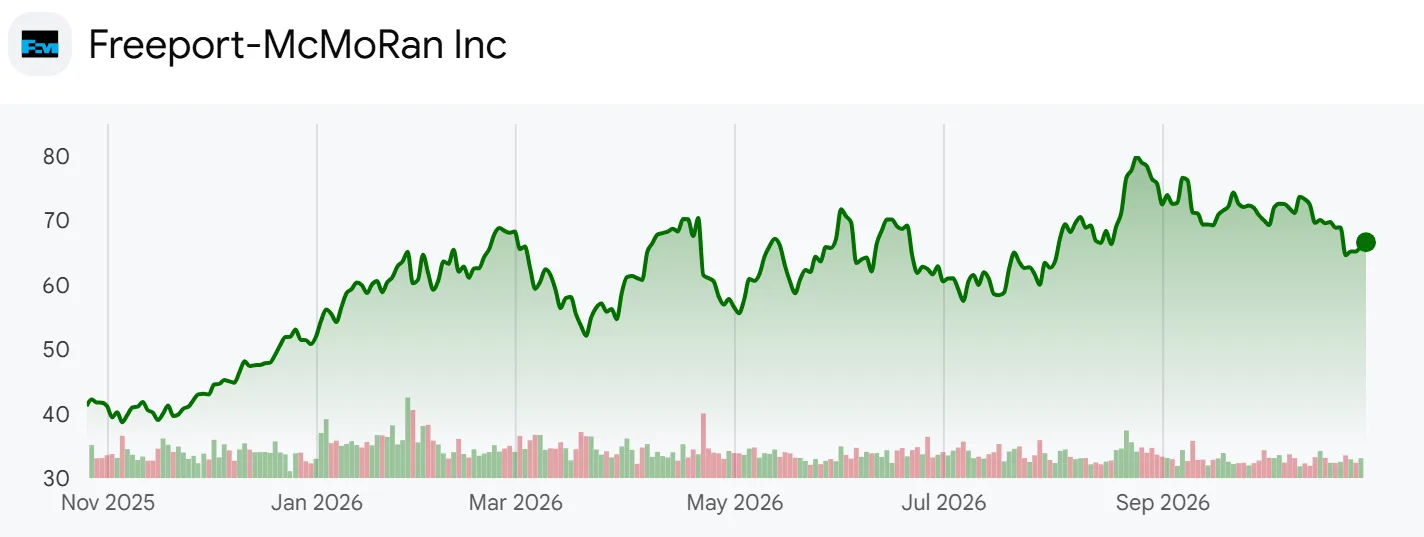
- The question here is how much of Grasberg’s volume recovery reaches FCX shareholders if copper cannot hold the price that made 2026’s earnings. The analysis lines up the Q3 earnings release and the 30-page Q3 call slides with copper sales, minority shares and unit costs from 23 quarterly releases since 2021, and checks them against the 2025 10-K and the Q2 10-Q. The P/E uses trailing twelve-month (TTM) GAAP diluted EPS of $2.38, or 27.98 times; first-quarter EPS includes a $0.14 gain from the Grasberg insurance settlement. Unit net cash cost is the company’s measure after by-product credits, and it excludes idle facility and restoration costs from the incident. Volumes are consolidated, including minority shares, unless noted.
What Slide 7 Says About Sales and Minority Shares
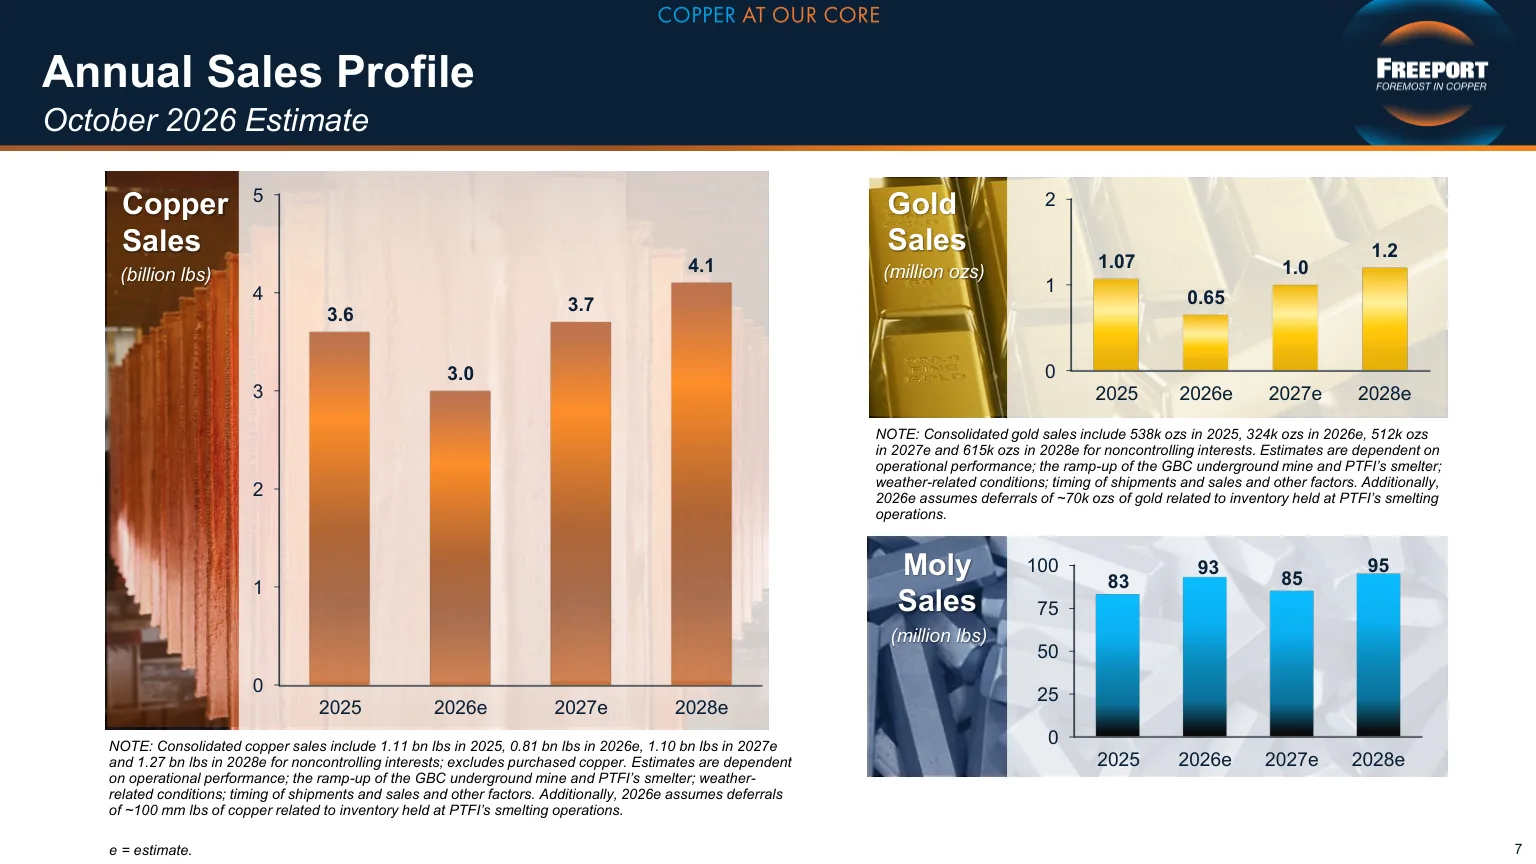
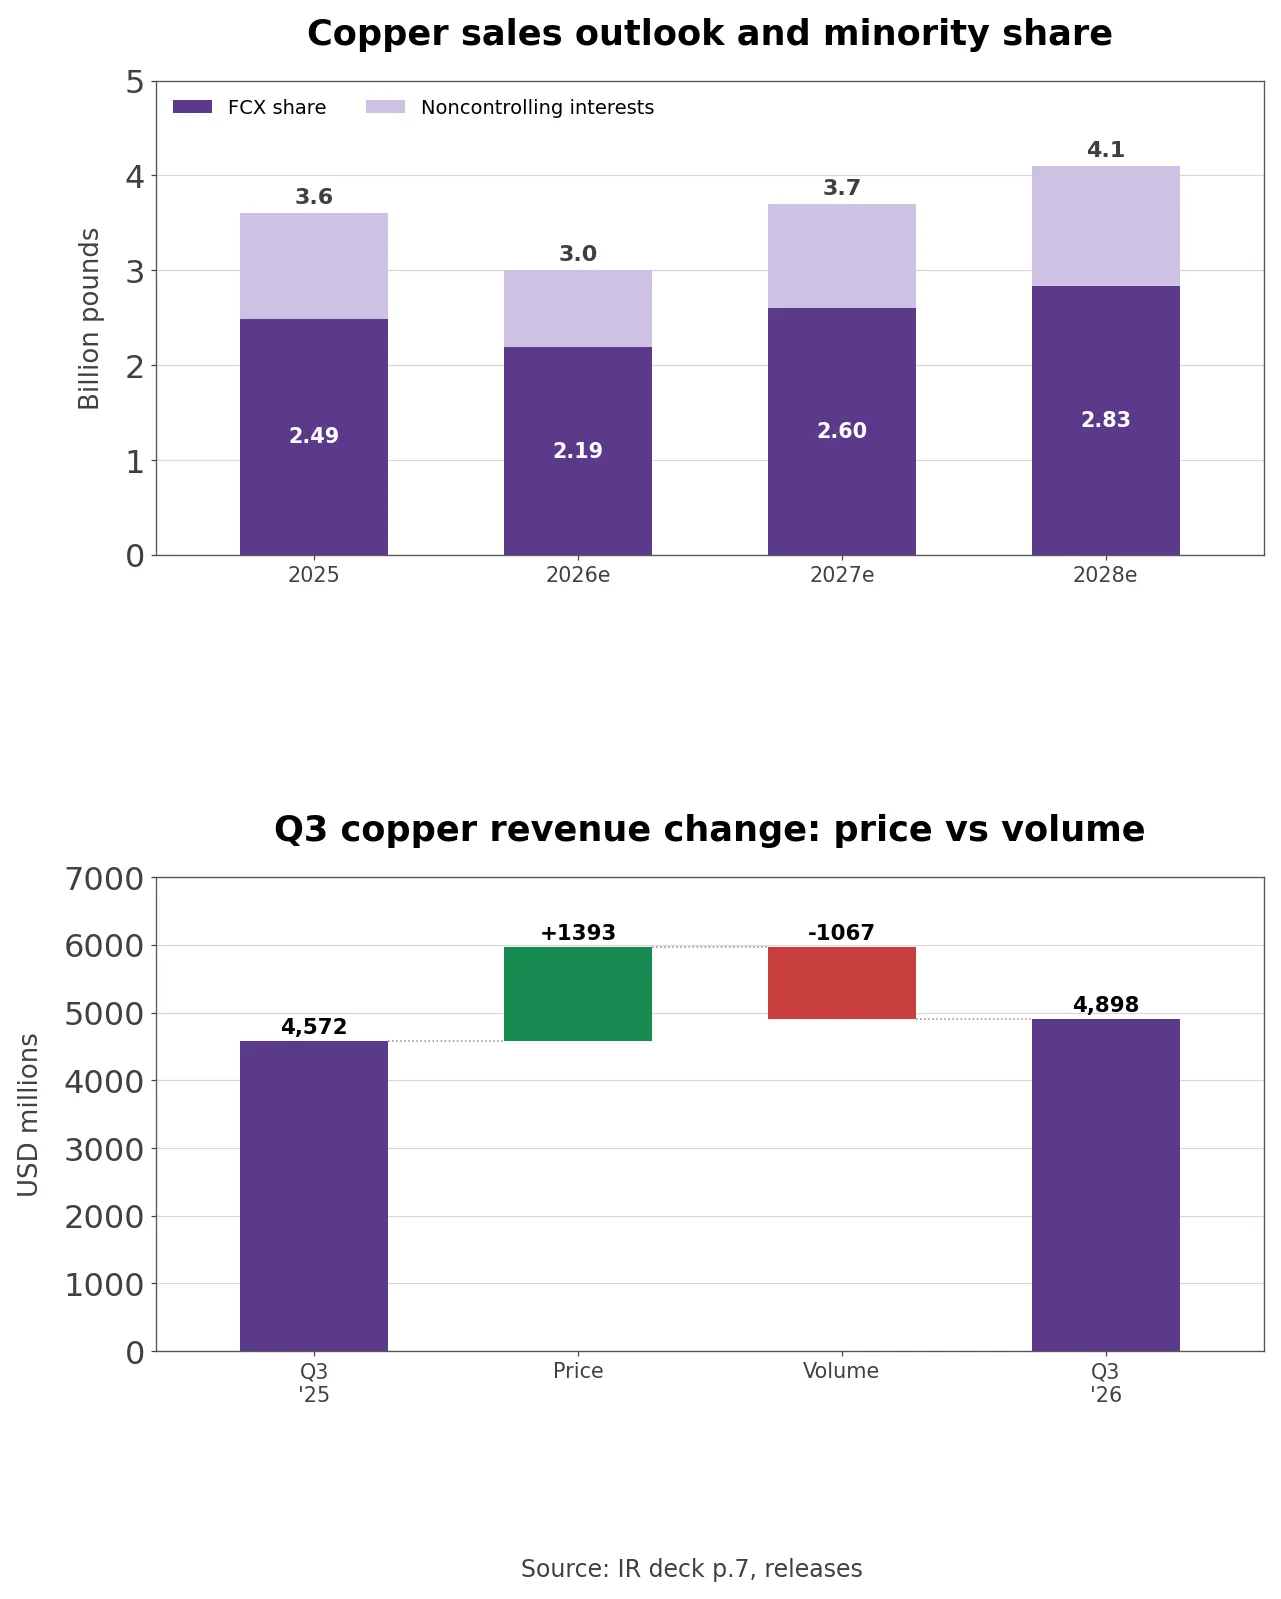
- Slide 3 of the Q3 deck sets operating cash flow at $2.0 billion against $1.7 billion, adjusted EBITDA at $3.2 billion against $2.8 billion and adjusted net income at $1.3 billion against $0.7 billion, and lists projected copper sales growth of 23% in 2027 and 11% in 2028. Slide 7 draws consolidated copper sales of 3.6 billion pounds in 2025, 3.0 billion in 2026, 3.7 billion in 2027 and 4.1 billion in 2028, and gold sales of 1.07, 0.65, 1.0 and 1.2 million ounces. Slide 22 projects fourth-quarter sales of 875 million pounds of copper, +16.8% from Q3, and 300 thousand ounces of gold, nearly three times Q3.
- The footnote on slide 7 reads: “Consolidated copper sales include 1.11 bn lbs in 2025, 0.81 bn lbs in 2026e, 1.10 bn lbs in 2027e and 1.27 bn lbs in 2028e for noncontrolling interests.” For gold the minority share is 538, 324, 512 and 615 thousand ounces. FCX owns 48.76% of PT Freeport Indonesia (PTFI), which runs Grasberg; the rest sits with Indonesia’s state mining holding company MIND ID and related parties.
- Own calculation (slide 7 footnote, 2025 to 2028 estimates): From 2026 to 2028 consolidated copper sales rise by 1.1 billion pounds, +36.7%, and 460 million of those pounds, 41.8%, go to noncontrolling interests. FCX’s own share rises from 2.19 billion to 2.83 billion pounds, or +29.2%, and 52.9% of the 550 thousand extra ounces of gold go to minority holders. In 2027 alone, consolidated sales grow 23.3% and FCX’s share 18.7%.
- Slide 6 splits the growth into three tracks: the Grasberg recovery, adding 700 million pounds in 2027 and 400 million in 2028; new leach technologies, from a 220-million-pound annual run rate to 300 million in 2027; and expansions at Bagdad (200 to 250 million pounds a year), Safford and Lone Star (300 to 400 million) and El Abra (700 million). On the same call, CFO Maree Robertson said 2026 copper sales were trimmed by about 2% on weaker U.S. and Chilean output, and 2027 by about 2.5% on an updated mine plan.
- Company disclosure (Q3 earnings release): CEO Kathleen Quirk said, “Favorable pricing for our products, particularly for copper and molybdenum, drove strong margins with substantial conversion to bottom-line results, highlighting the strength of our diversified portfolio.”
- Filing note (2025 10-K): The 10-K explains that FCX took about 81% of PTFI’s net income through 2022 and 48.76% from 2023 on. The February 2026 memorandum of understanding with Indonesia keeps FCX at 48.76% through 2041 and at about 37% from 2042.
Idle Facility Costs and Copper Price Sensitivity
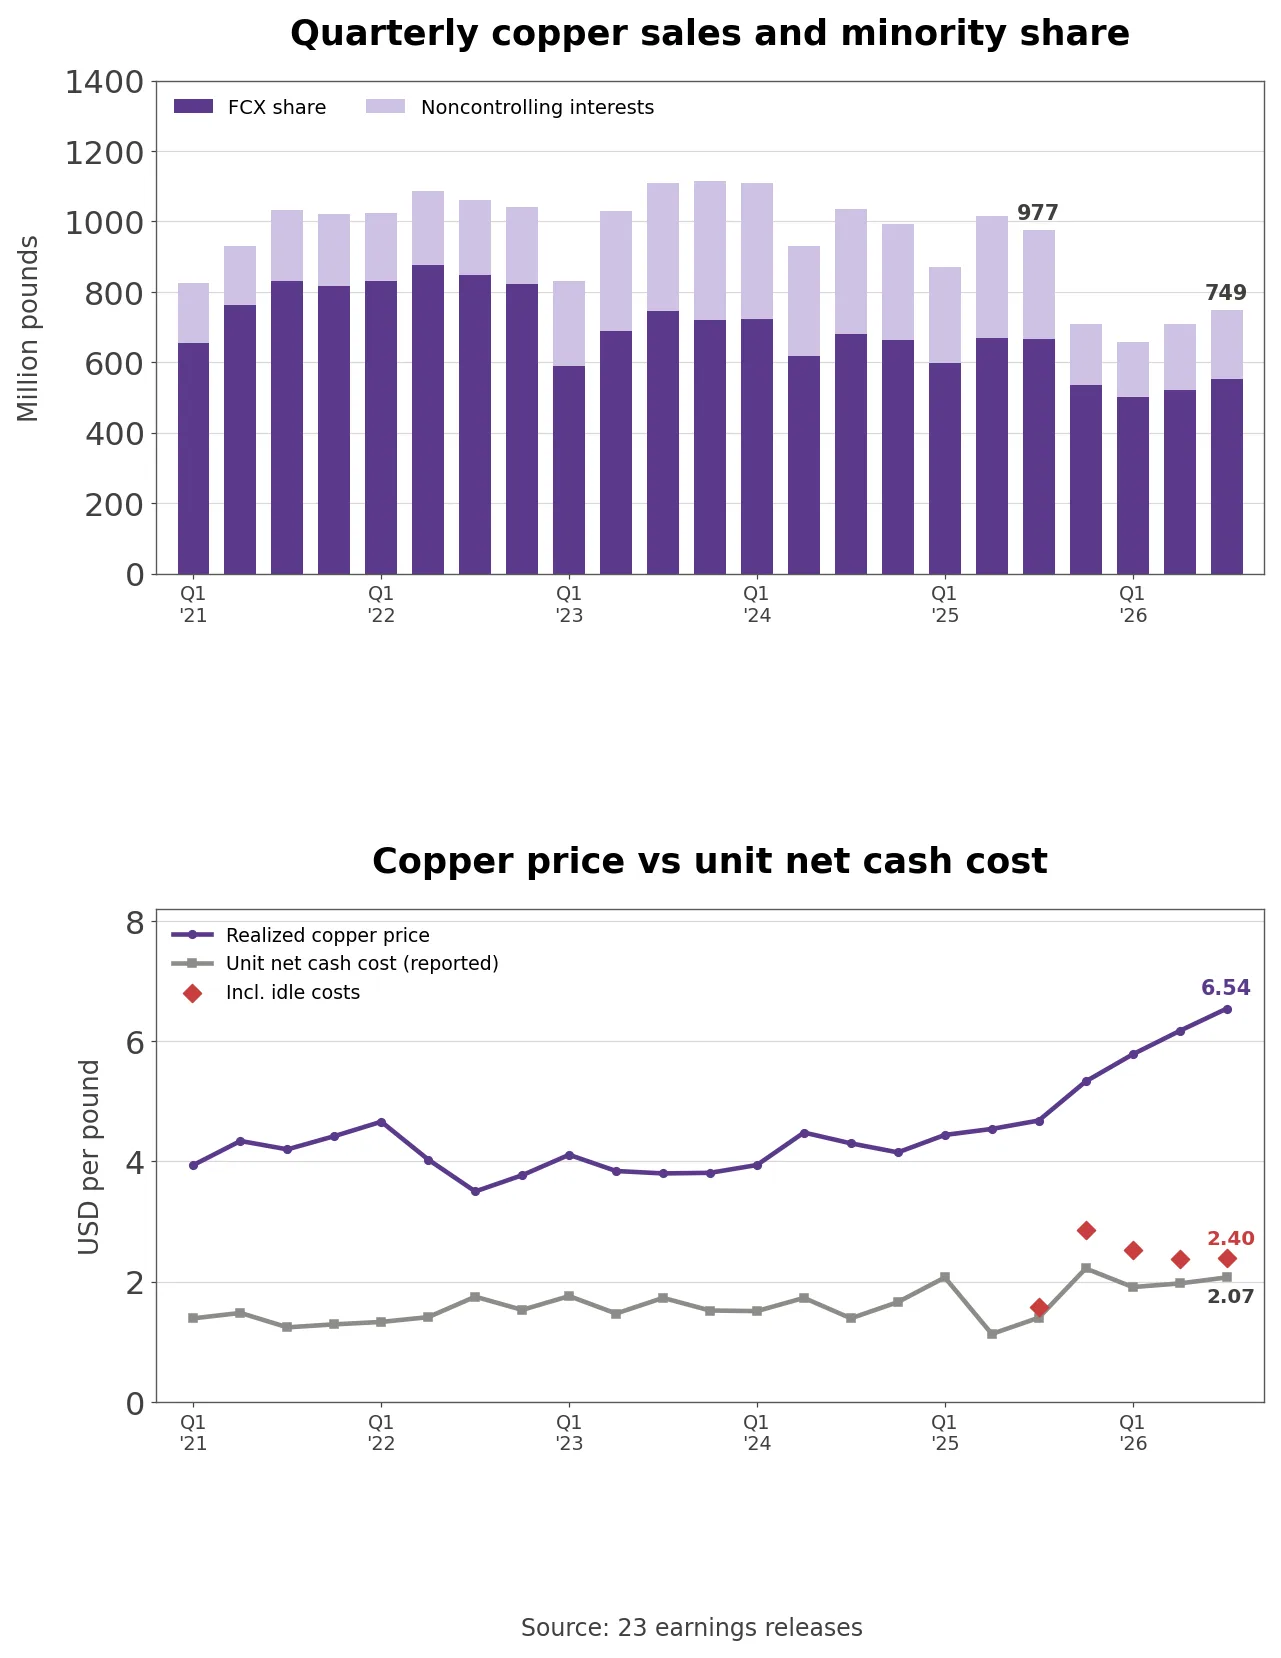
- Slide 20 holds 2026 unit net cash cost at $1.90 a pound, and its footnote excludes $1.2 billion of projected idle facility and restoration costs from the mud rush incident, $0.25 billion of it in Q4. The release explains why: “a portion of PTFI’s production and delivery costs will be recognized as idle facility costs, which are non-inventoriable.” Q3’s $244 million, or $1.59 per pound of PTFI copper, sat outside reported unit costs.
- Own calculation (five releases, Q3 2025 to Q3 2026): Adding the idle and restoration costs back over copper sales puts Q3 unit cost at $2.40 rather than $2.07, and Q4 2025 at $2.86 rather than $2.22. Spreading $1.2 billion over 3.0 billion pounds lifts the 2026 guidance from $1.90 to $2.30.
- On the call, Robertson described these as essentially fixed costs, said they would no longer be broken out from 2027 and would sit in unit costs, and called it an accounting classification rather than a change in cost. She added that PTFI copper sales should rise from about 700 million pounds this year to 1.2 billion next year. The 2027 unit cost will be the same fixed cost spread over more pounds, not a cost that disappears.
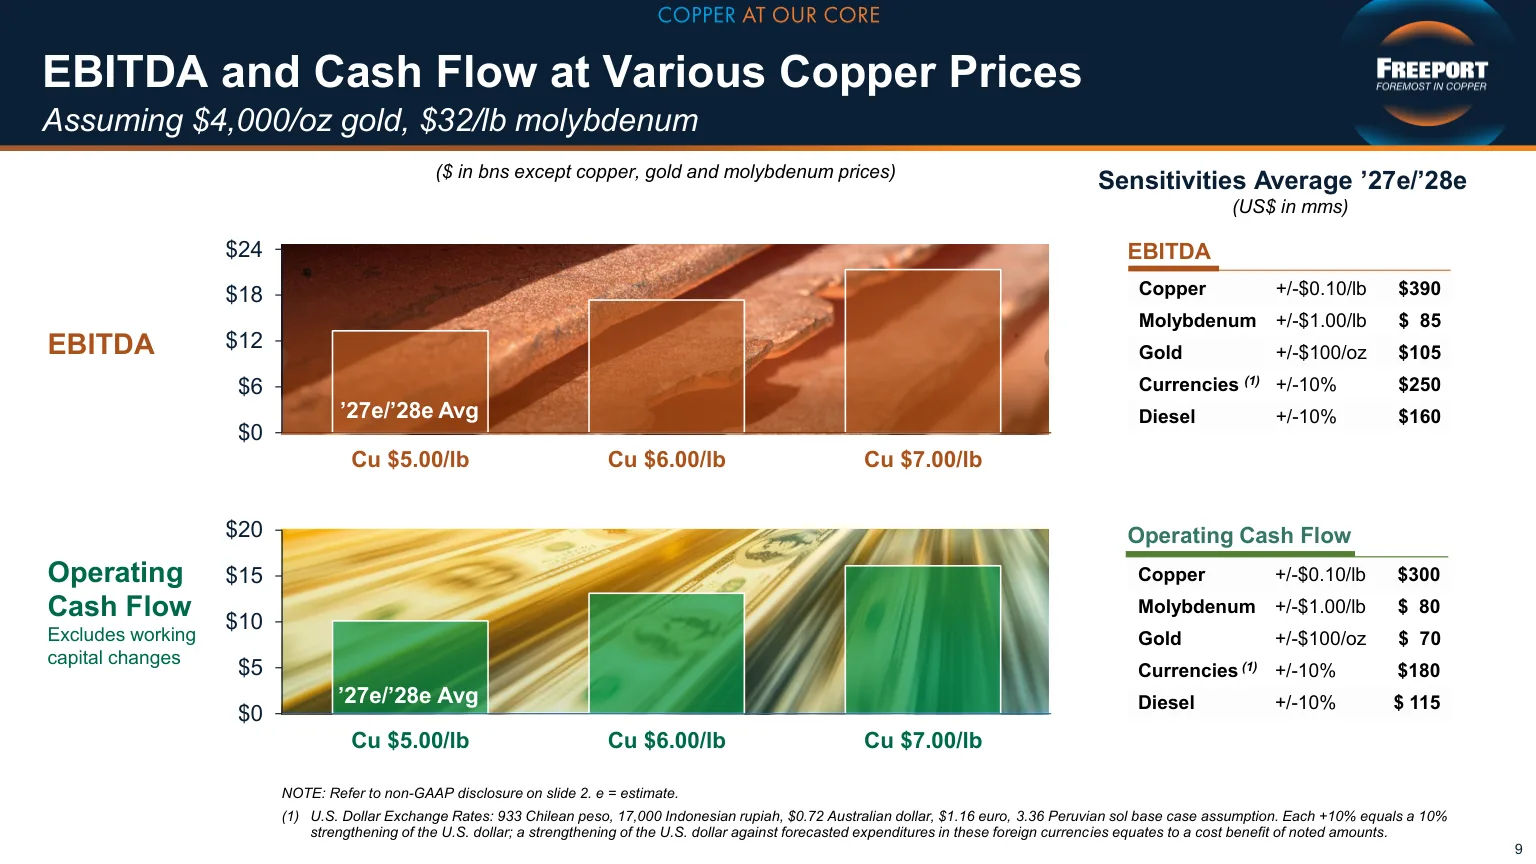
- Slide 9 puts the sensitivity for the 2027 and 2028 average at $390 million of EBITDA and $300 million of operating cash flow for each $0.10 a pound in copper. Robertson said annual EBITDA would be above $12 billion at $5 copper and about $19.5 billion at $7. Slide 8 puts the 2026 energy cost impact at about $500 million versus 2025 and spot sulfuric acid at more than double the 2025 average, and 2027 capital spending is now about $5.2 billion, roughly $400 million above the July estimate. Slide 10 shows that about half of 2027’s $2.0 billion of discretionary projects are Kucing Liar development and a Grasberg LNG power plant, and discretionary spending is excluded from the cash flow used to set shareholder returns.
- Slides 5 and 24 track the restart. The Grasberg Block Cave mining rate rose from 53 thousand to 70 thousand metric tons a day between Q2 and Q3, Production Blocks 2 and 3 hit planned rates in both quarters, material handling upgrades finish in early 2027, and Production Block 1S is due to restart by mid-2027.
The Bull and Bear Case for Freeport Shares
- The bull case rests on volume and demand. Grasberg mill throughput reached 67% of capacity in Q3, and the company expects 80% by mid-2027 and close to full capacity by year-end 2027. Management says this growth needs no new capital, the Bagdad expansion decision is due in Q4, and Q4 copper and gold sales should be the year’s highest. U.S. customers report strong copper demand from power, data centers and transportation.
- The bear case rests on the source and ownership of earnings. Q3’s profit gain came from price, not volume, and about 42% of the extra copper ahead belongs to minority holders. The $1.2 billion kept out of 2026 unit costs returns to costs in 2027, capital spending is rising to $5.2 billion, price-to-book of 4.56 sits in the 88th percentile of 59 months, and gold exports from Indonesia face a 10% export duty question.
From an 81% Economic Share to the Grasberg Mud Rush
- Freeport’s month-end close went from $6.75 in March 2020 to $49.74 in March 2022. The 2018 transaction gave MIND ID and related parties 51.24% of PTFI, but the former joint venture’s profit-sharing kept FCX’s take near 81% through 2022. TTM EPS was $3.45 in March 2022; once FCX’s share of PTFI profit fell to 48.76% in 2023, it was $1.79 by March 2023. The minority share of consolidated copper sales rose from 19.9% in 2022 to 34.0% in 2024.
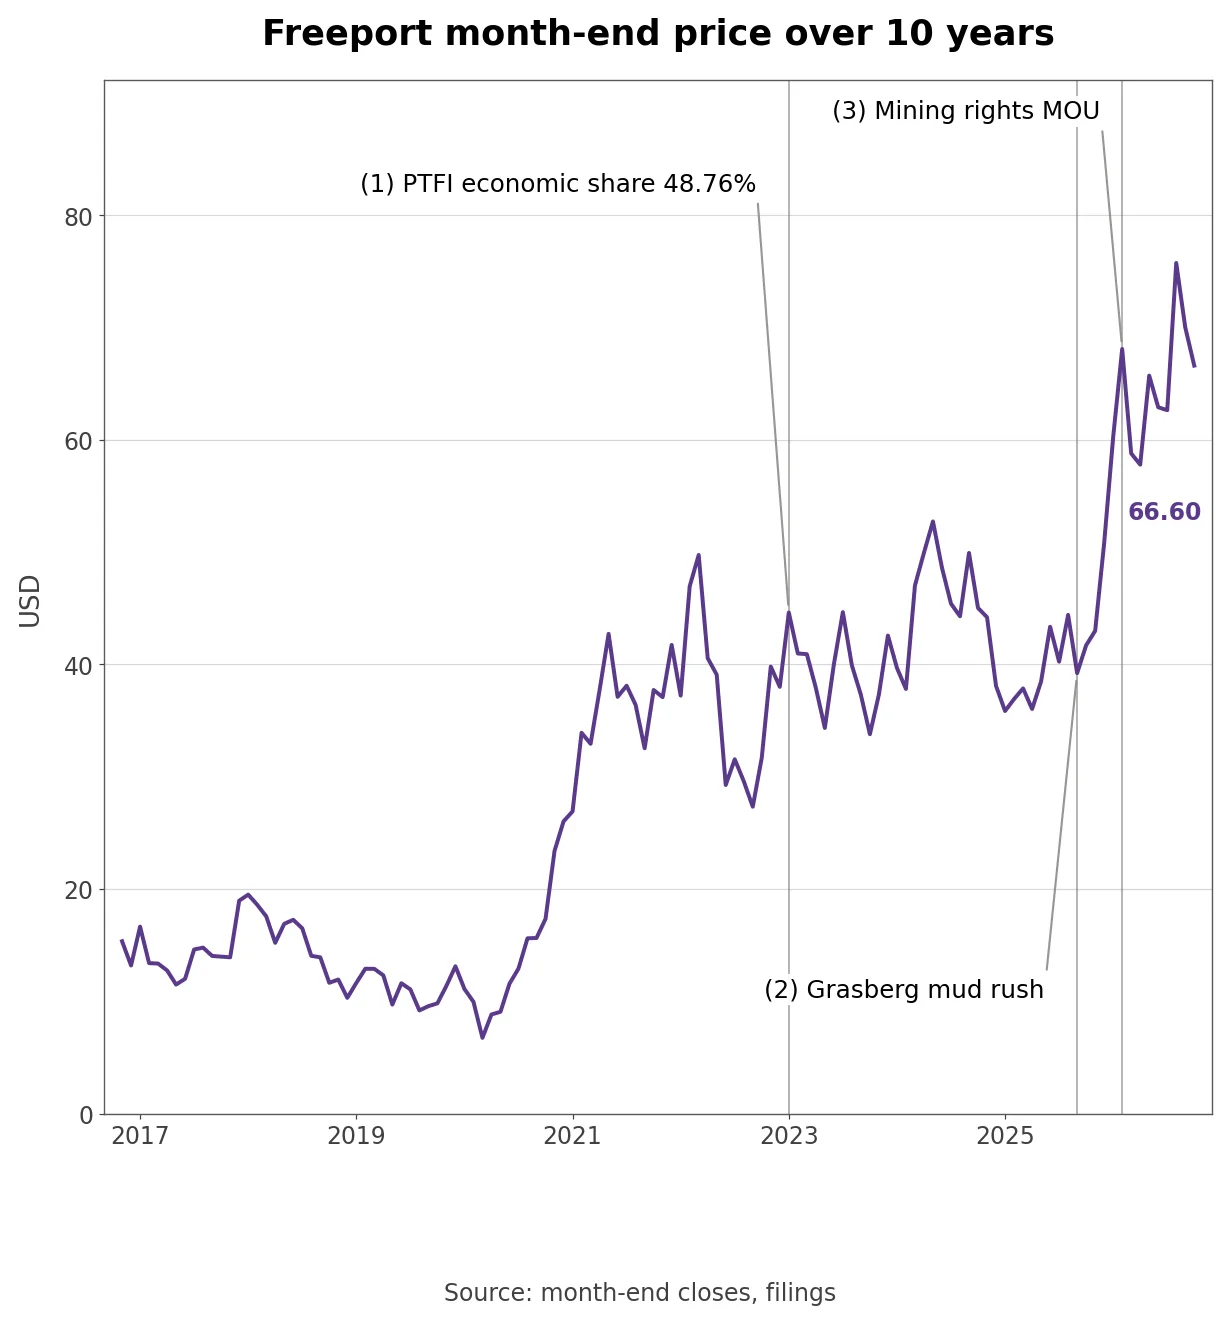
- In September 2025 an external mud rush at the Grasberg Block Cave underground mine halted production, and the stock closed that month at $39.22. Consolidated copper sales fell from 1.016 billion pounds in Q2 2025, the last full quarter before the incident, to 657 million in Q1 2026. In November 2025 the company published its restart plan and added a risk factor warning that the phased restart might not go as planned. PTFI booked a $699 million pre-tax insurance settlement in Q1 2026, restarted Production Blocks 2 and 3 at the end of March, and restarted its smelter in late August. With the February rights memorandum in hand, the stock is now 1.70 times its incident-month close.
How Did Higher Copper Prices Cover the Volume Drop?
- Q3 copper revenue, sales times realized price, rose $326 million, from $4.572 billion to $4.898 billion. Selling 228 million fewer pounds cost -$1.067 billion, and the higher price added +$1.393 billion, more than covering it.
- Own calculation (23 releases, Q1 2021 to Q3 2026): Q3’s 749 million pounds of copper sales were the fourth lowest of the 23 quarters. The realized price, however, has set a new high four quarters running, from $4.68 in Q3 2025 to $5.33, $5.78, $6.17 and $6.54, and diluted EPS of $0.81 ranks third behind $1.04 in Q1 2022 and $0.94 in Q3 2021.
- By region, Q3 unit cost was $3.16 in the U.S. and $2.39 in South America, while Indonesia showed a credit of $0.84 a pound because gold credits exceeded costs, down from $0.92 a year earlier. Gold fell further than copper: Q3 sales of 105 thousand ounces were -68.8%, and the company said about 60 thousand ounces of refined Indonesian gold moved into Q4. PTFI produced 249 million pounds of copper in Q3 but sold only 153 million, the difference sitting as in-process inventory at the restarted smelters. Lower gold sales mean lower by-product credits, which is why consolidated unit cost of $2.07 came in above July’s $2.00 estimate.
- The Q4 outlook follows the same pattern. Unit cost is guided at $1.68 because gold sales rise to 300 thousand ounces; adding Q4’s $250 million of idle costs over 875 million pounds gives $1.97. For 2026 as a whole, production exceeds sales by about 100 million pounds of copper and 70 thousand ounces of gold held at PTFI’s smelters. Molybdenum helped on price: the realized price rose from $24.07 to $32.46 a pound and sales from 19 to 22 million pounds, and U.S. mine by-product credits rose from $0.61 to $0.89 a pound.
- Gold exports carry an open issue. The release says that “current regulations (specifying a 10% export duty) conflict with the terms in PTFI’s special mining business license (IUPK),” and PTFI is seeking clarity from the government before exporting gold beyond domestic demand in Q4.
How Freeport Makes Money From Three Regions
- Copper made up 75% of 2025 revenue, gold 15% and molybdenum 8%. In the U.S., Freeport runs seven copper mines, including Morenci (72% interest), Bagdad, Safford and Sierrita in Arizona and Chino and Tyrone in New Mexico, plus a smelter in Miami, Arizona, and a refinery in El Paso; it sold 66% of 2025 U.S. copper as rod for wire makers, and Morenci led Q3 U.S. sales at 123 million pounds. South America has Cerro Verde in Peru (55.66%) and El Abra in Chile (51%), and the Climax and Henderson mines in Colorado make it the world’s largest molybdenum producer.
- Costs differ sharply by region. Slide 21 puts 2026 unit net cash cost at $3.08 in the U.S. and $2.59 in South America, while Indonesia shows a credit of $1.25 because gold by-products exceed costs. At normal rates Grasberg’s three underground mines produce about 1.7 billion pounds of copper and 1.3 million ounces of gold a year, and slide 23 plans Grasberg copper output of 0.8 billion pounds in 2026, 1.5 billion in 2028 and 1.6 billion in 2030.
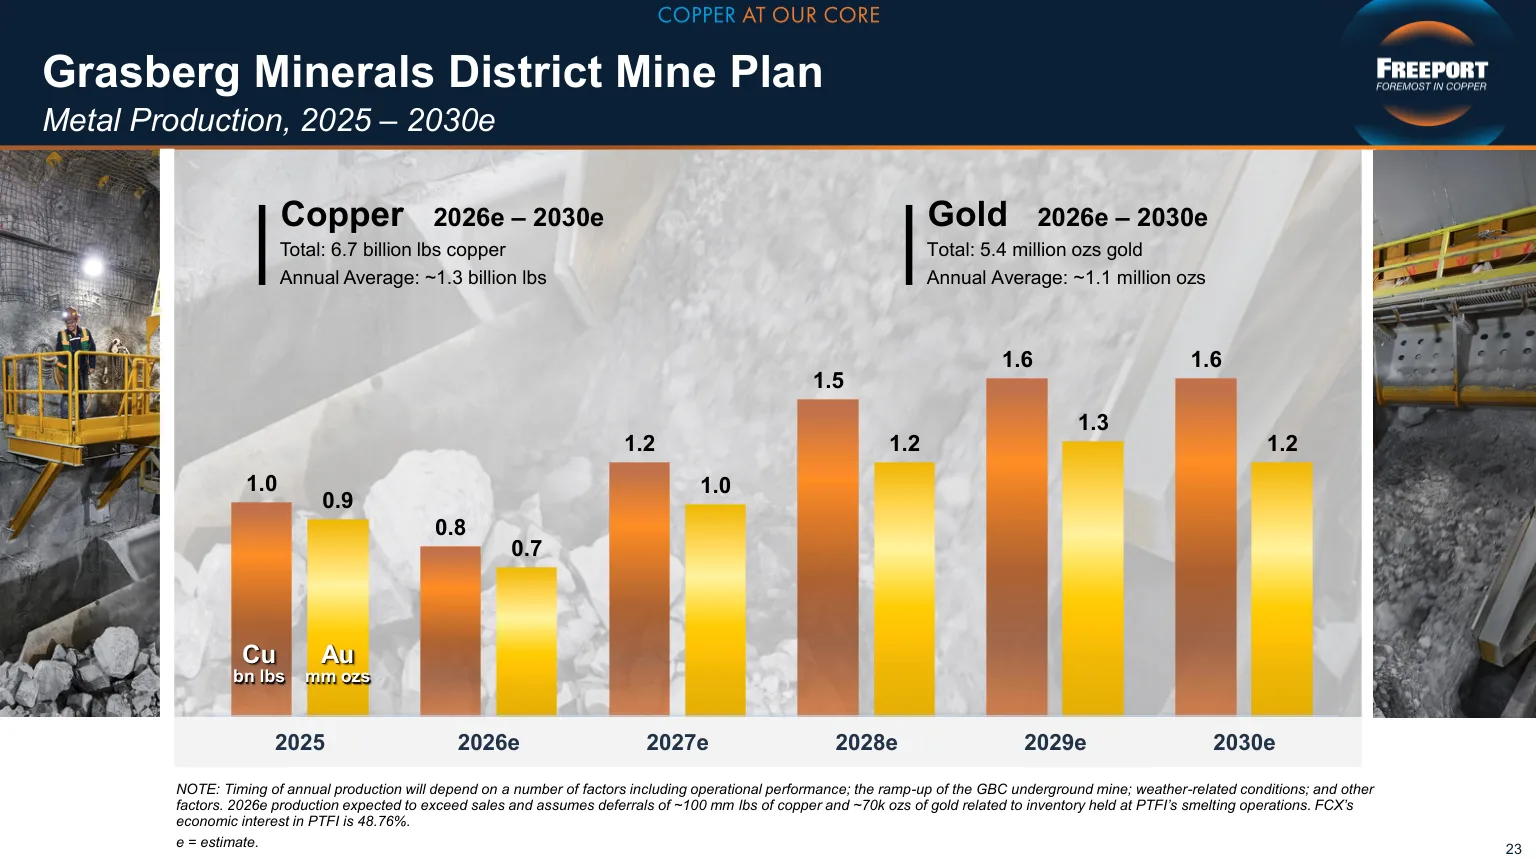
- In Indonesia, PTFI’s smelter and the 66%-owned PT Smelting can produce up to about 800 thousand metric tons of cathode a year, and a precious metals refinery handles the gold, so PTFI now sells refined copper and gold instead of concentrate. Copper reserves split 38% U.S., 40% South America and 22% Indonesia, while 97% of gold reserves are in Indonesia. About $1.6 billion has gone into Kucing Liar, Grasberg’s next ore body, with roughly $4 billion more through 2033.
U.S. Copper Tariffs and the Bagdad Expansion
- The 10-K says Freeport supplies about 70% of U.S. refined copper. A 50% Section 232 tariff on semi-finished copper took effect in August 2025, but “refined copper, including cathodes, concentrates and scrap, was exempted from the tariff,” and a possible refined copper tariff of 15% in 2027 rising to 30% in 2028 was still under review in the Q2 10-Q. COMEX copper averaged 7% above LME in 2025, but Q3 realized prices were nearly identical across regions: $6.55 in the U.S., $6.56 in South America and $6.48 in Indonesia.
- The leach program has slipped a year. The 10-K reported, “In late 2025, we achieved an annual run rate of approximately 240 million pounds of copper,” with a 2026 target of 300 million. The Q3 release targets growth “from the current run rate of approximately 220 million pounds of copper per annum to 300 million pounds in 2027.” A next-generation additive that recovered more than four times as much copper as the first version in lab tests goes to the field in 2027. U.S. mines also ran 3% to 5% below plan in Q3 because of extreme weather, with unit cost at $3.16.
- Bagdad is next. Doubling concentrator capacity would add 200 to 250 million pounds of copper a year for about $4.5 billion of incremental capital, with the decision due in Q4. El Abra’s expansion, more than 700 million pounds a year for about $7.5 billion, entered environmental review in March, and initial studies on a 300 to 400 million pound Safford and Lone Star expansion finish in 2027.
How Freeport Compares With Three Copper Peers
- The peers are three U.S.-listed copper producers whose earnings ride the same copper price: Southern Copper, a low-cost pure copper miner in Mexico and Peru; Teck, a Canadian copper and zinc miner; and Hudbay, a mid-sized copper producer in the Americas.
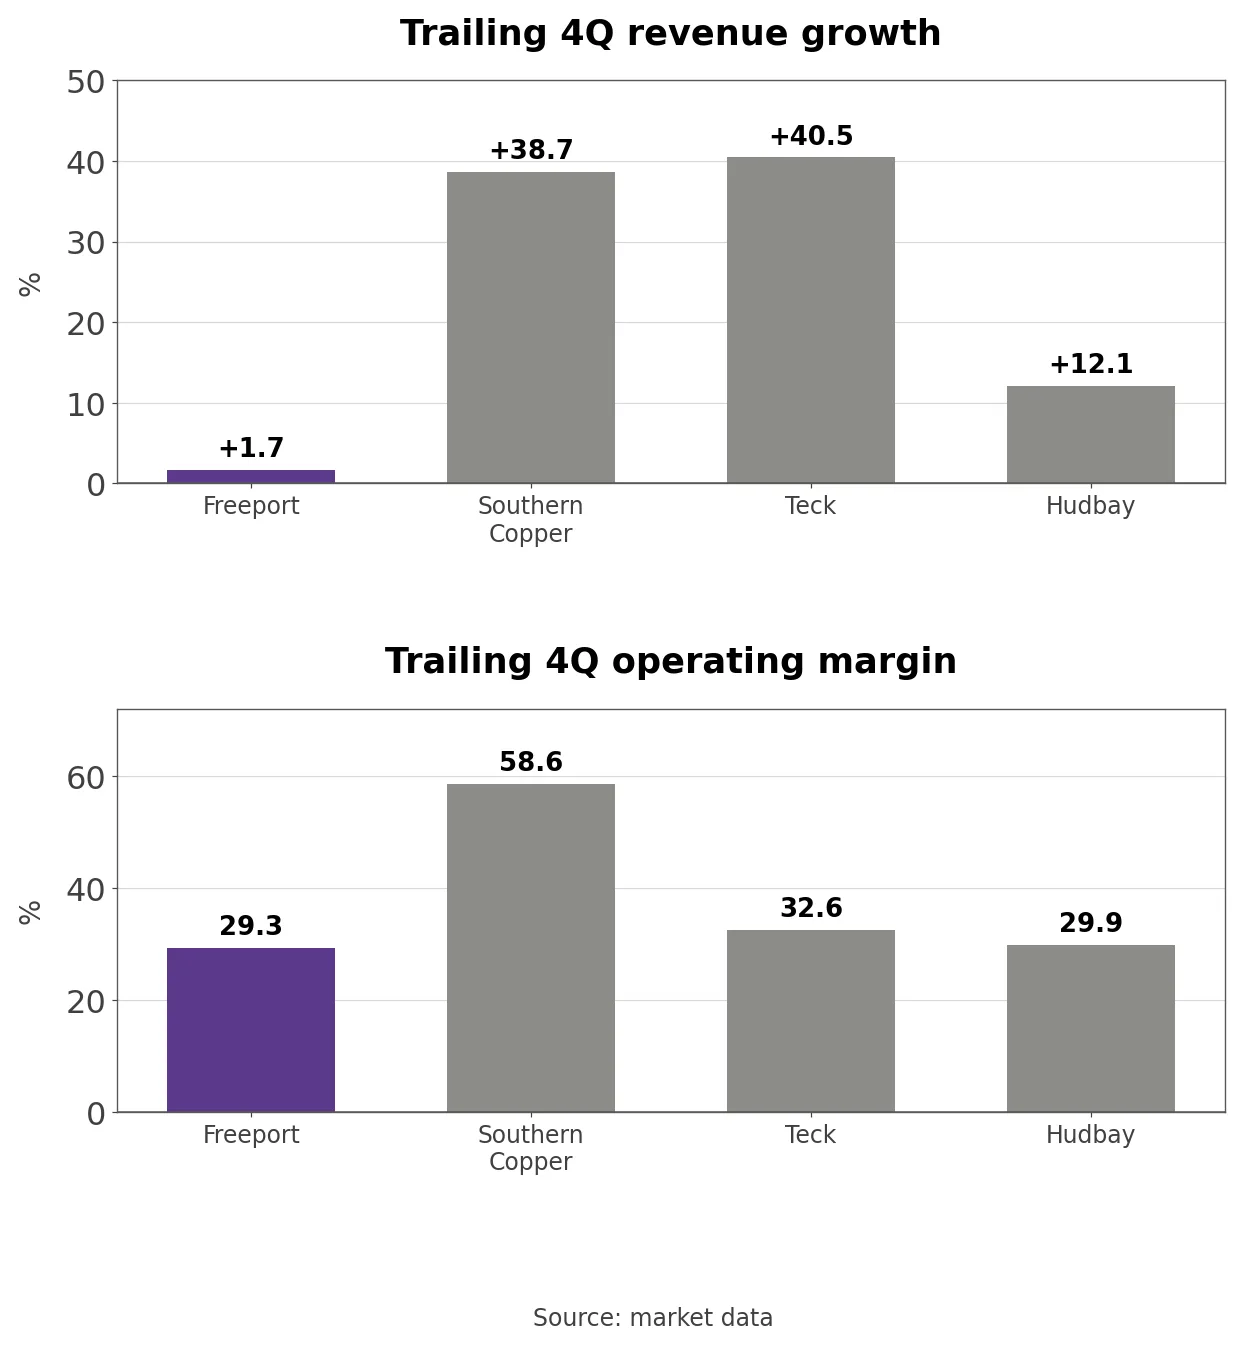
- Over each company’s latest four quarters, revenue grew +40.5% at Teck, +38.7% at Southern Copper and +12.1% at Hudbay, but only +1.7% at Freeport (Teck and Hudbay through Q2 2026). All four enjoyed the same copper rally; Freeport alone sold less. Operating margin was 58.6% at Southern Copper, 32.6% at Teck, 29.9% at Hudbay and 29.3% at Freeport.
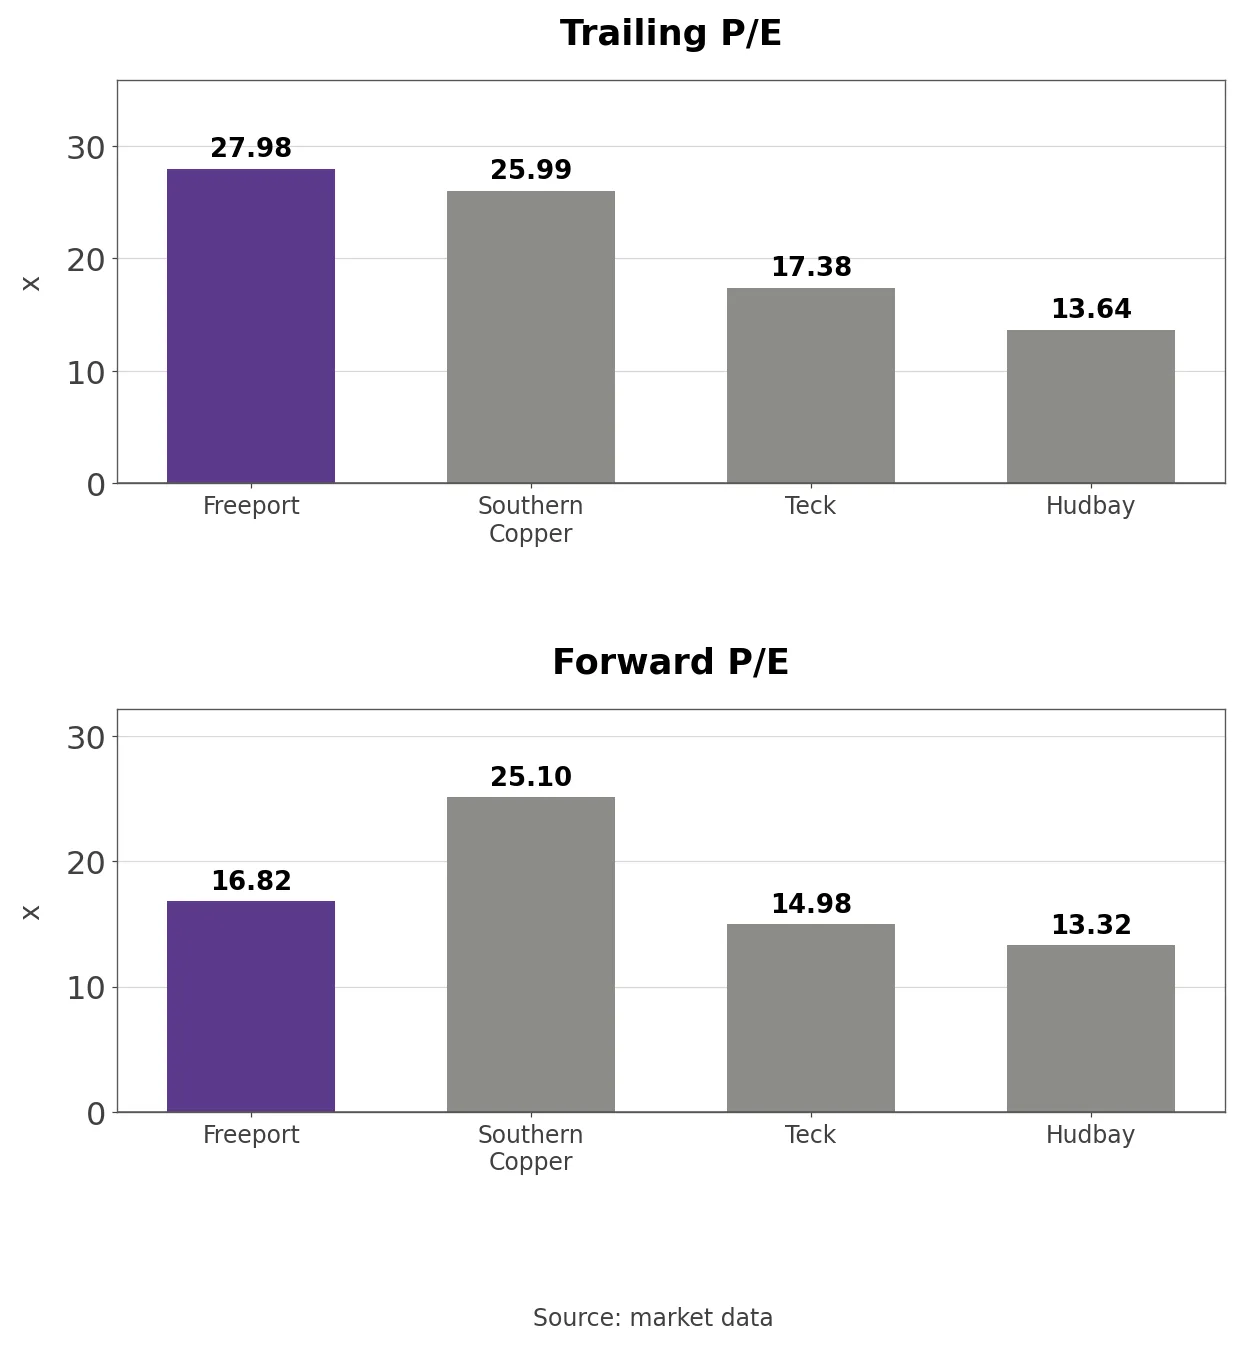
- Trailing P/E is highest at Freeport, 27.98, against 25.99 at Southern Copper, 17.38 at Teck and 13.64 at Hudbay, while forward P/E is 25.10 at Southern Copper, 16.82 at Freeport, 14.98 at Teck and 13.32 at Hudbay. The gap between trailing and forward P/E is 11.16 at Freeport against 0.89, 2.40 and 0.32 at the peers, so the market is already pricing in the Grasberg recovery. Under its financial policy Freeport returns up to 50% of available cash flow and keeps net debt within a $3 billion to $4 billion target; it returned $955 million through Q3, $650 million in dividends and $305 million in buybacks, and net debt was $1.8 billion excluding $3.2 billion of PTFI downstream project debt.
Freeport’s P/E and Price-to-Book Band
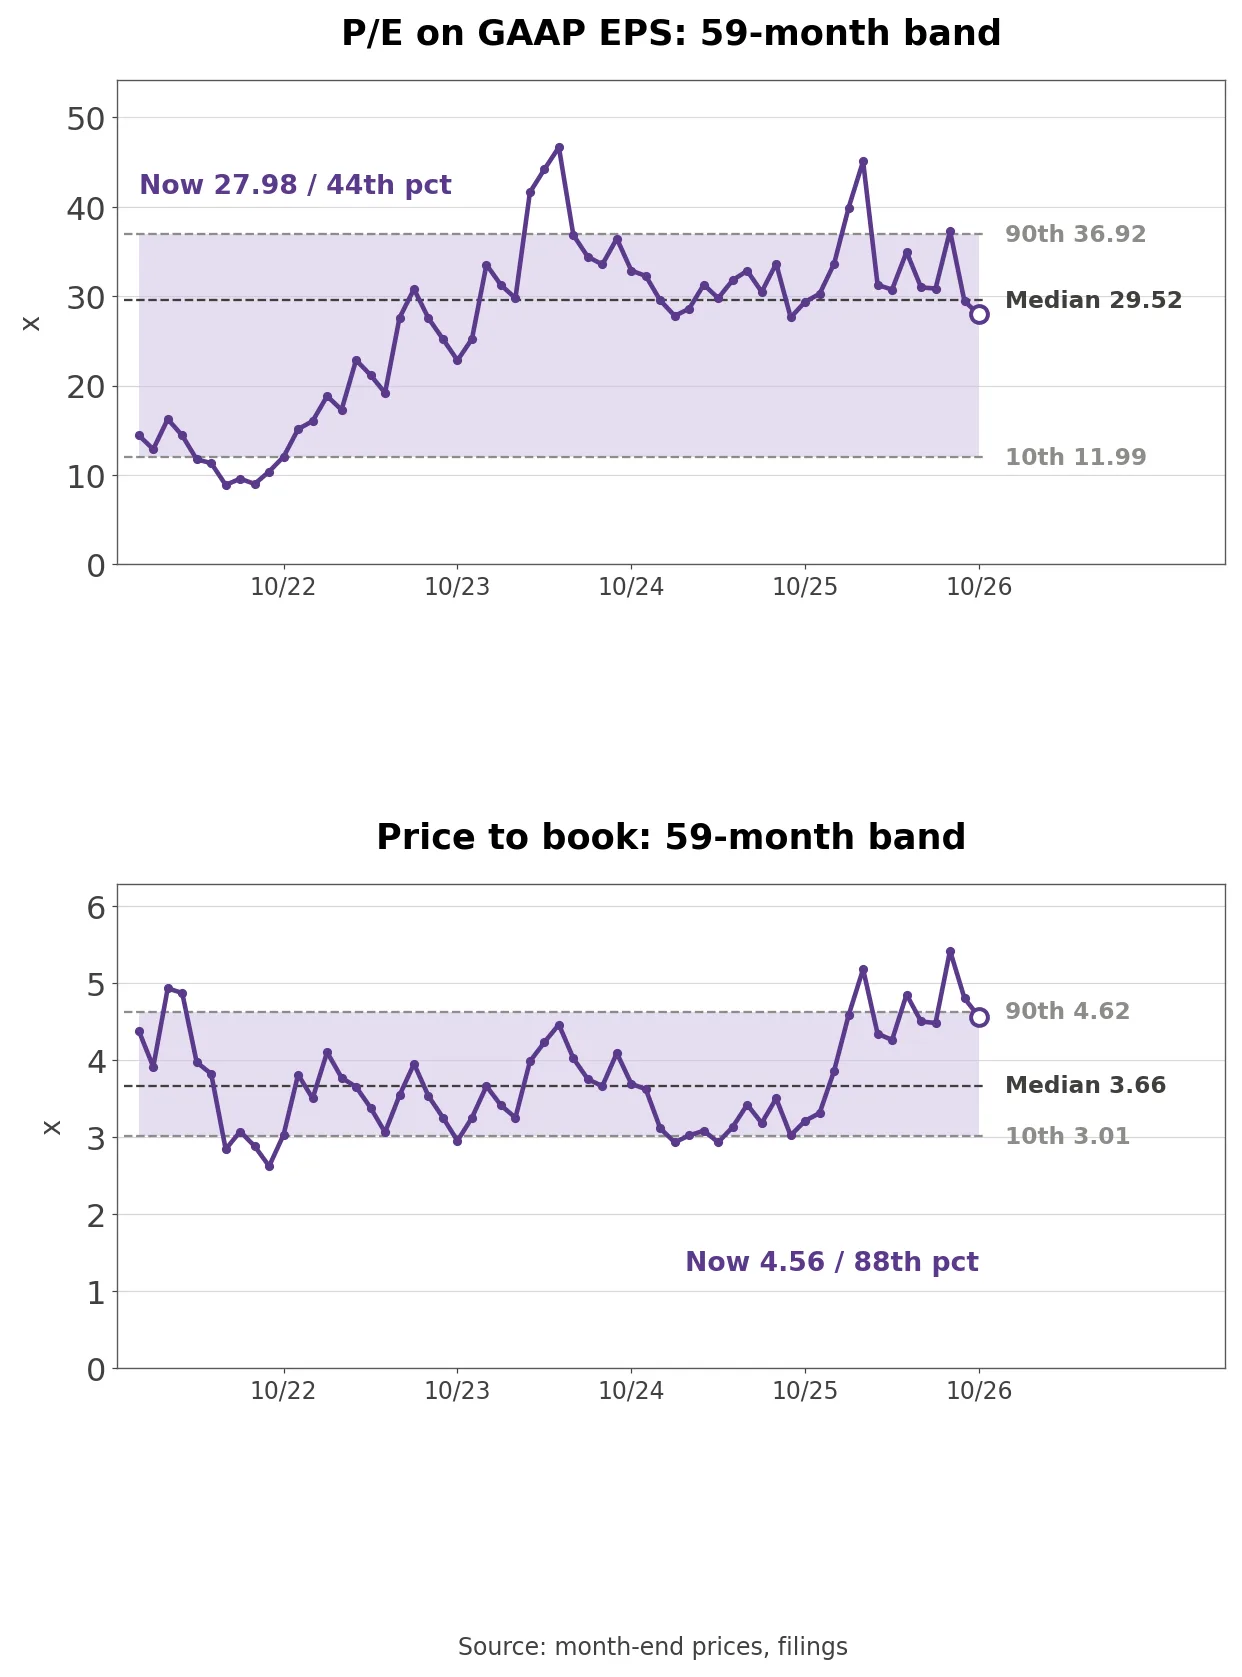
- The P/E on TTM GAAP diluted EPS is 27.98, in the 44th percentile of the 59 months since December 2021 and below the 29.52 median. The low was 8.89 in June 2022 when earnings were high, and the high 46.66 in May 2024. The P/E sits below its median with the stock near a high because the copper price lifted EPS too.
- Price-to-book is 4.56, in the 88th percentile and 0.90 above the 3.66 median; the peak was 5.42 in August. Beyond $20.98 billion of equity attributable to FCX, the balance sheet carries $12.63 billion of noncontrolling interests, so a large share of book assets does not belong to FCX shareholders.
- Outside view (consensus estimates, market data): Average EPS estimates are $1.03 for Q4, $3.33 for 2026 and $4.33 for 2027. The 2027 figure is 5.9% above its level 90 days ago, putting the stock at 15.4 times 2027 and 20.0 times 2026 estimates.
Three Conditions That Move the Stock
- Realized copper price was $6.54 a pound in Q3. With each $0.10 worth $390 million of 2027 and 2028 EBITDA, copper holding above $6 lets volume growth lift earnings; a move back to the $5 range would use the extra volume to fill in for lower prices.
- Grasberg throughput was 67% of capacity in Q3. If it reaches 80% by mid-2027 and Production Block 1S restarts on time, fixed costs spread over more pounds and unit cost falls; if dry-weather milling problems or restart delays hold volume back, unit cost rises in the same year idle costs move into it.
- Indonesian gold exports affect part of the 300 thousand ounces planned for Q4. If the government allows exports without duty under the IUPK and completes the rights extension, gold credits keep Indonesian costs low; a 10% duty or a delayed extension would put Indonesian costs and the post-2041 ownership terms back in question.
What to Watch in the Fourth-Quarter Report
- The next numbers come with Q4 results around January 2027. The first check is whether Freeport actually sold 875 million pounds of copper and 300 thousand ounces of gold, and what 2027 unit cost guidance looks like once idle costs are included; the Bagdad investment decision should come before that.
- One question remains open. Filings do not show how much of the fixed cost moving into 2027 unit costs will shrink as volume grows and how much, like energy and sulfuric acid, will keep rising. In a year when copper is cheaper than today, can earnings still grow for shareholders who keep only about 58% of the extra copper?
Related Analysis
- Linde (LIN) Stock Analysis: Price, Volume and Margin Trends: another materials company whose results split into price and volume, useful for comparing how much of Freeport’s 2026 profit came from price alone.
- Sumitomo Electric (5802) Stock Analysis: Data Center Optics: a wire and cable maker riding data center and power grid spending, the same demand that takes 66% of Freeport’s U.S. copper as rod.