GE Vernova (GEV) Stock: Deposits Drive the $16B Cash Guide
Contents
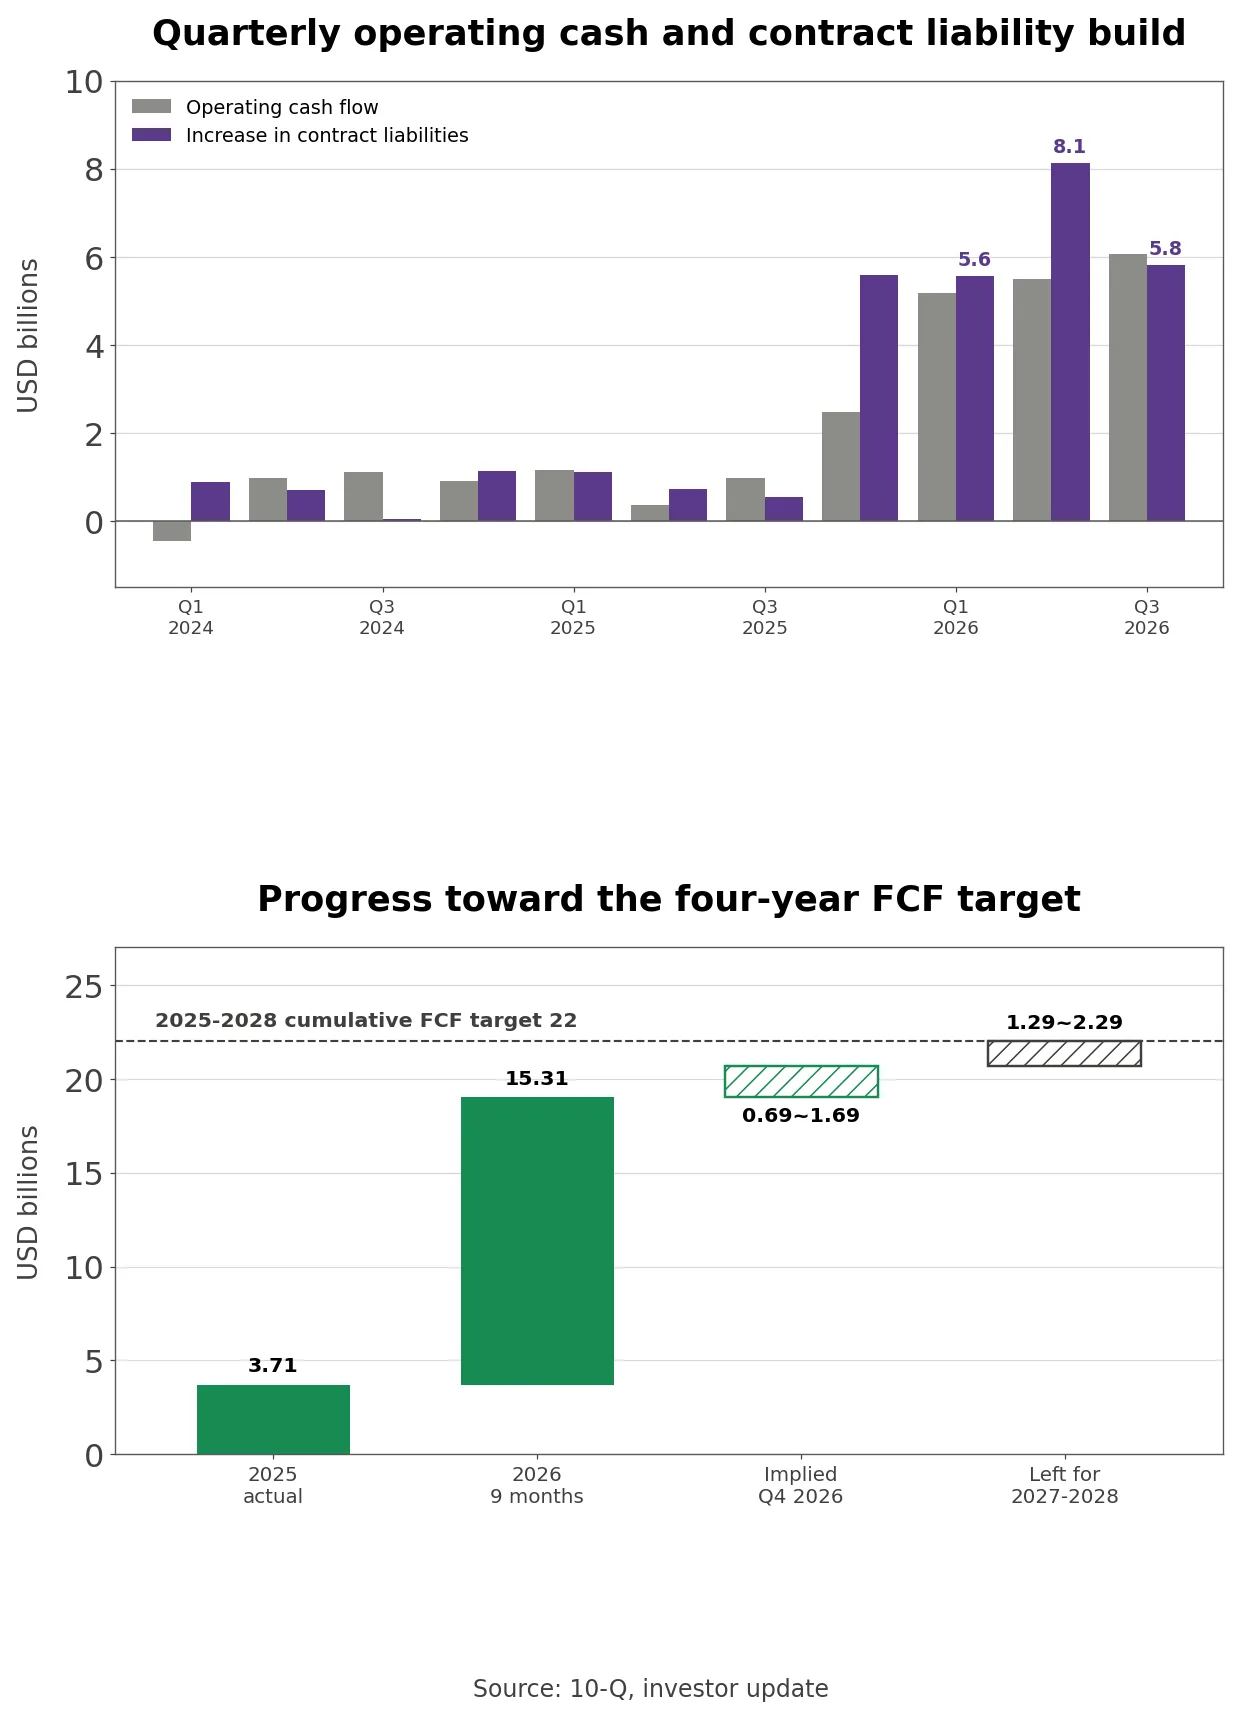
- GE Vernova (NYSE: GEV) raised its 2026 free cash flow guidance to $16 billion to $17 billion from $11.5 billion to $12.5 billion with its third-quarter results. The same guidance implies adjusted EBITDA of about $6.3 billion to $6.9 billion, so the company now expects cash of roughly 2.5 times its operating profit. The difference is money customers paid up front for gas turbine orders and production slots. Strip the $19.511 billion rise in contract liabilities out of nine-month operating cash flow of $16.737 billion and the figure turns negative at $2.774 billion.
- GE Vernova was spun off from GE in April 2024 and runs three segments: Power (gas, nuclear, hydro and steam equipment and services), Electrification (transformers, switchgear, HVDC and grid software) and Wind. At an $857.87 close it is worth about $227.1 billion on market data.
- The question here is how that cash fits the company’s December 2025 target of at least $22 billion of cumulative free cash flow from 2025 through 2028. The analysis lines up the Q3 2026 earnings release, the Q3 presentation and call transcript on the IR site, the Q3 2026 10-Q, the December 2025 investor update transcript and all 11 quarterly earnings releases since the spin-off.
- Two caveats apply. Free cash flow and adjusted EBITDA are company-defined non-GAAP measures, and nine-month GAAP net income of $6.687 billion includes a $3.992 billion pre-tax gain from remeasuring the Prolec GE stake. Gas gigawatts under contract and the production rate come from management statements, not audited figures.
What the Q3 Deck Says About Cash and Guidance
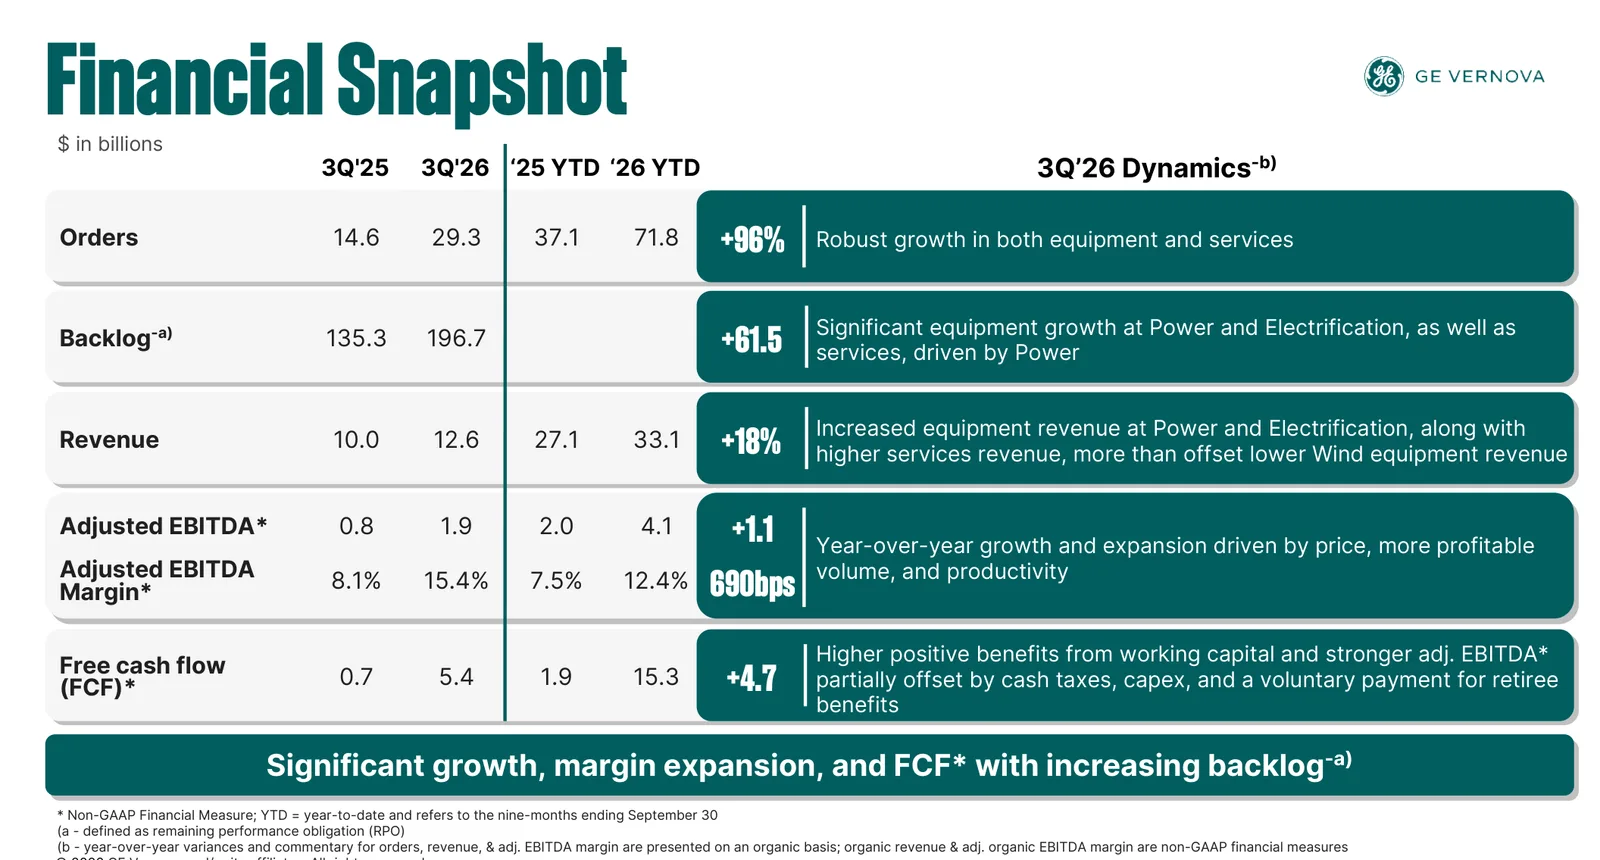
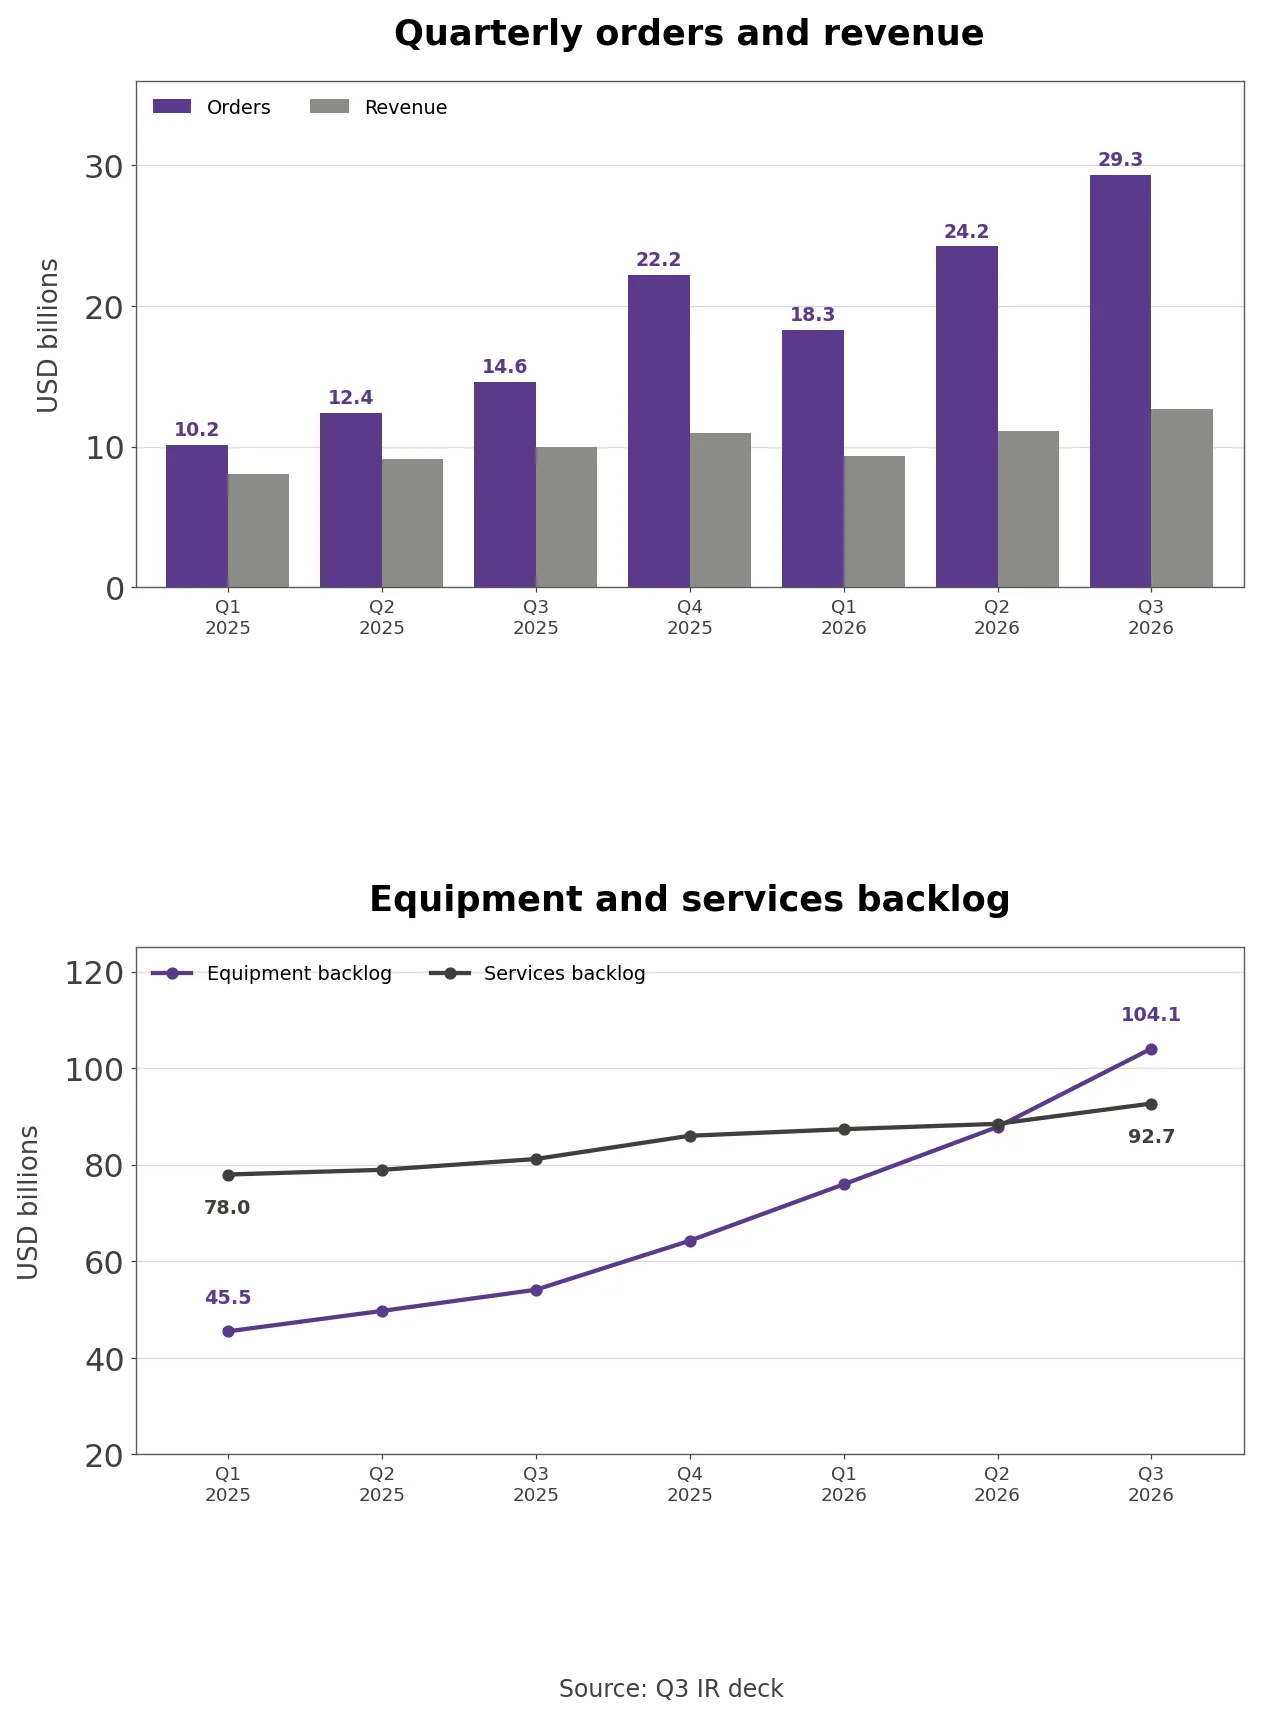
- The Q3 deck runs 43 pages, and pages 4 through 11 cover the Trench Group acquisition announced the same day. The page 14 snapshot puts orders of $29.3 billion against $14.6 billion a year earlier, backlog of $196.7 billion against $135.3 billion, revenue of $12.6 billion with organic growth of +18%, adjusted EBITDA of $1.9 billion at a 15.4% margin, and free cash flow of $5.4 billion against $0.7 billion. Its note on free cash flow credits working capital and stronger adjusted EBITDA, offset by cash taxes, capex and a voluntary retiree benefit payment. Orders ran at 2.32 times revenue.
- The page 28 appendix shows how fast the order book turned. Quarterly orders rose from $10.152 billion in Q1 2025 to $29.318 billion in Q3 2026, and equipment made up $24.296 billion of the latest quarter. Services orders barely moved, from $4.392 billion to $5.022 billion. Equipment is ordered years before it ships, often with a deposit, so a surge in equipment orders brings cash in well before revenue.
- Company disclosure (Q3 2026 earnings call, October 28, 2026): CFO Ken Parks said working capital was a $5.3 billion cash benefit, “driven primarily by down payments on increased orders and slot reservations at Power”. Asked about financing strains or slot cancellations, CEO Scott Strazik said there was “no change in our cash terms required to secure the equipment”.
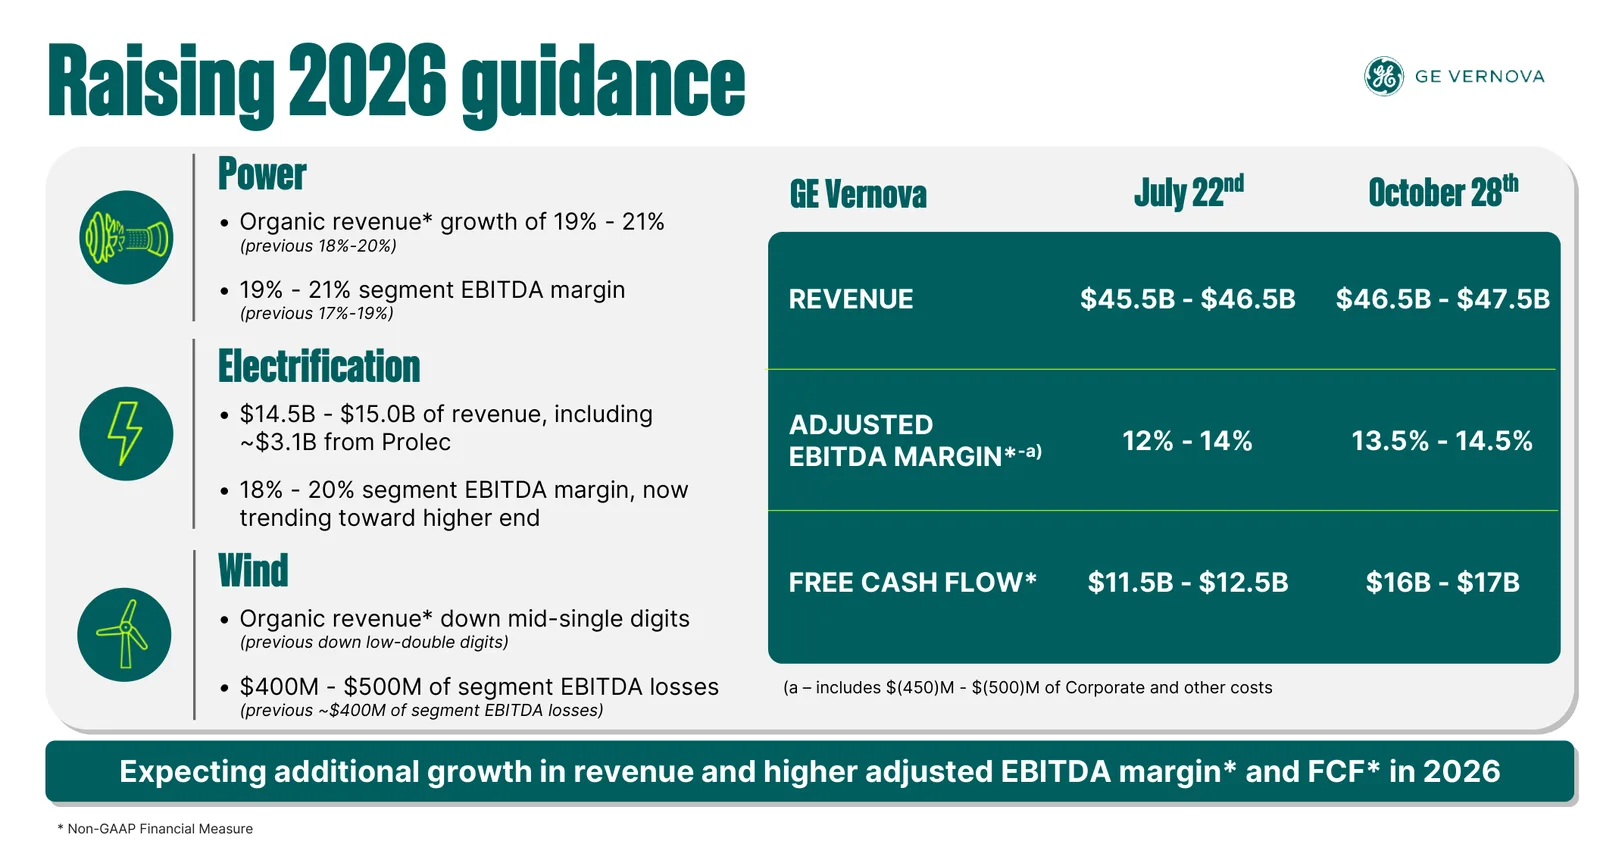
- Page 18 sets the July and October guidance side by side. Revenue moved to $46.5 billion to $47.5 billion from $45.5 billion to $46.5 billion, the adjusted EBITDA margin to 13.5% to 14.5% from 12% to 14%, and free cash flow to $16 billion to $17 billion from $11.5 billion to $12.5 billion.
- Cash rose far more than profit. At the midpoints, adjusted EBITDA guidance went from about $5.98 billion to $6.58 billion, up $0.6 billion, while free cash flow guidance went from $12.0 billion to $16.5 billion, up $4.5 billion. How much is left for the fourth quarter?
- Own calculation (11 quarterly earnings releases): Nine-month free cash flow was $15.307 billion, so the full-year range implies fourth-quarter free cash flow of only $0.693 billion to $1.693 billion. That is 14% to 33% of the $5.1 billion quarterly average so far, in a quarter whose implied adjusted EBITDA of $2.19 billion to $2.80 billion would be the year’s highest.
- Page 35 lists the buybacks by quarter. The average price paid rose from $303 in Q1 2025 to $720, $952 and $949 in the first three quarters of 2026 and $924 in October, and 2026 purchases through September came to $5.275 billion. The $5.7 billion returned to shareholders in nine months equals 37.2% of nine-month free cash flow, much of which arrived as customer deposits.
Power Margins and Gas Turbine Units in the Q3 Deck
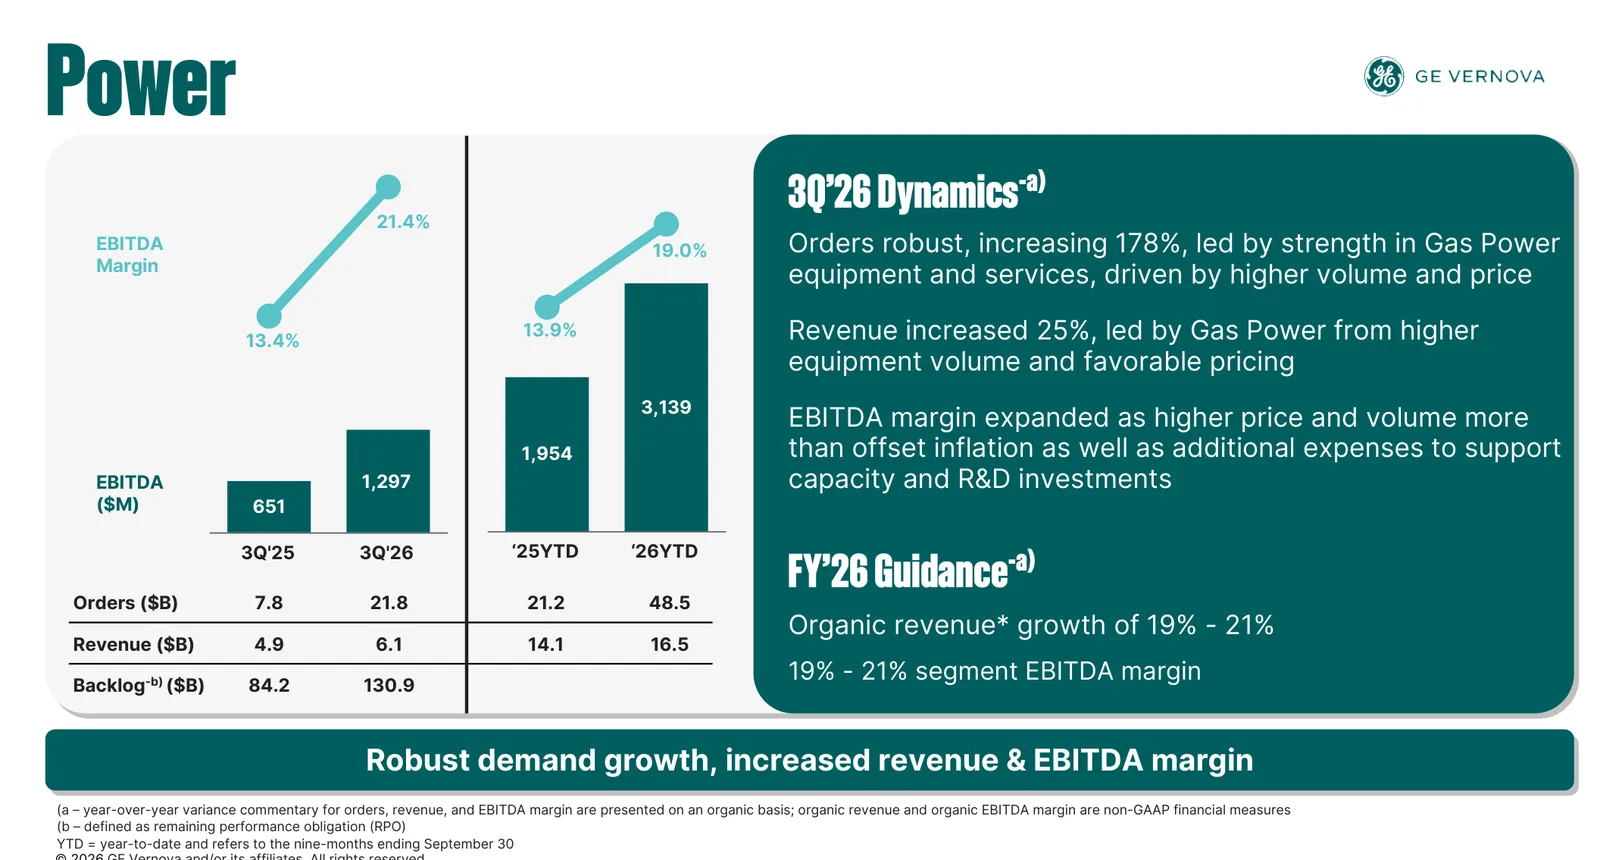
- Page 15 shows Power segment EBITDA doubling to $1.297 billion from $651 million and the margin rising to 21.4% from 13.4%, with orders of $21.8 billion against $7.8 billion and backlog of $130.9 billion against $84.2 billion. The slide credits price and volume for more than offsetting inflation and capacity spending. The page 30 appendix breaks Q3 Power revenue of $6.067 billion into $5.117 billion of gas, $719 million of nuclear and $231 million of hydro; equipment revenue grew +65% to $2.870 billion while services grew +2% to $3.197 billion.
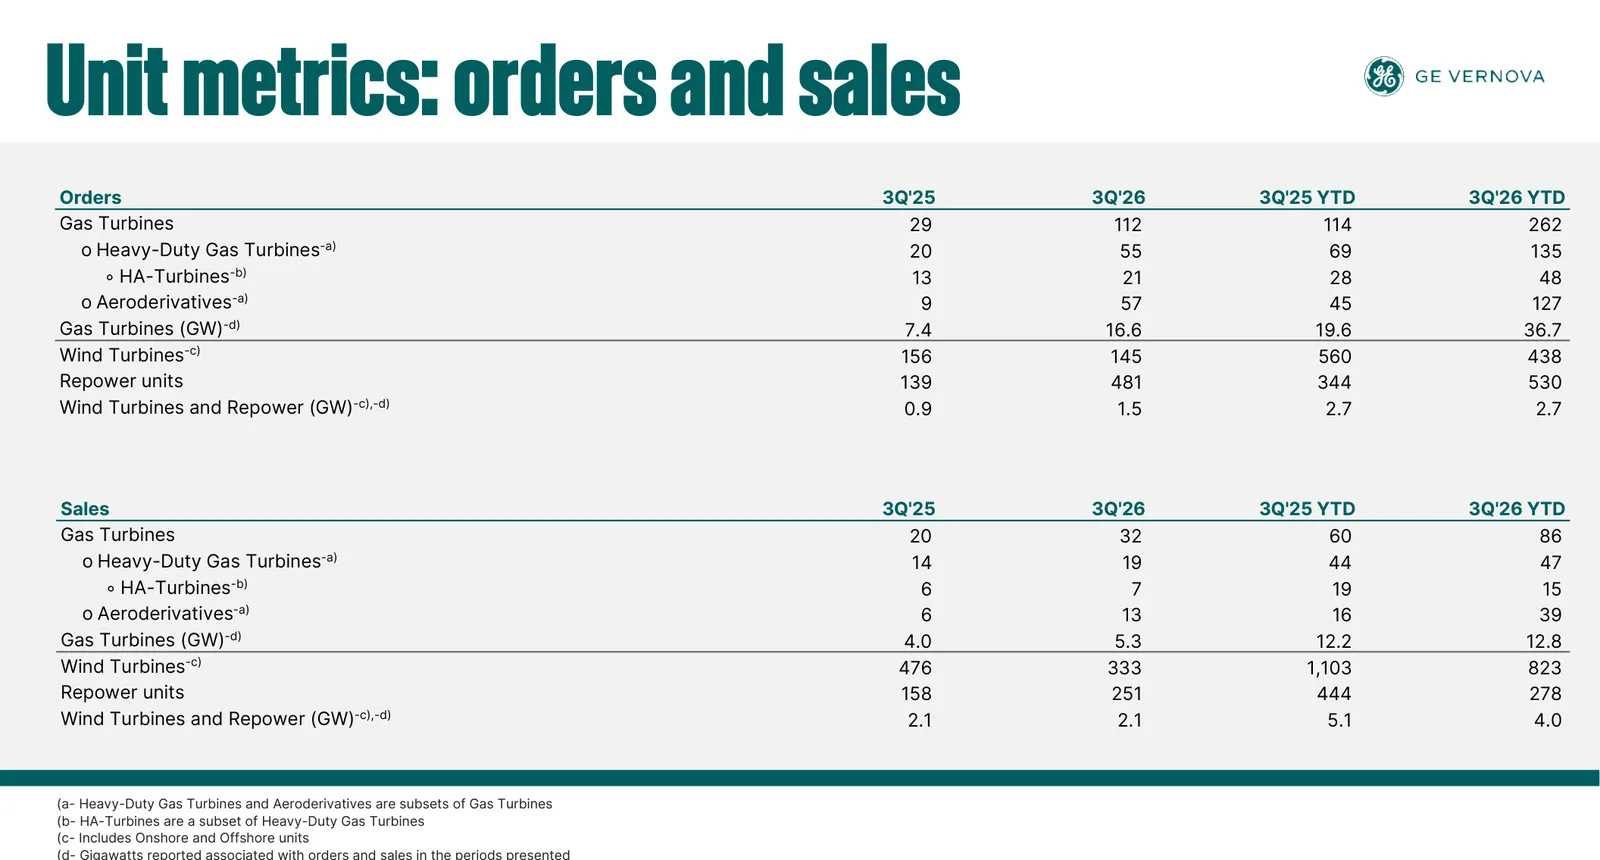
- Page 34 counts turbines. Q3 gas turbine orders were 112 units (16.6 GW) against 29 units (7.4 GW) a year earlier, including 55 heavy-duty units and 57 aeroderivatives, while sales were 32 units (5.3 GW). Of the newest HA heavy-duty units, 21 were ordered and 7 sold. Over nine months the company ordered 262 turbines and 36.7 GW and sold 86 turbines and 12.8 GW.
- Pricing is the other half. Strazik said Q3 orders were priced more than 20% above fourth-quarter 2025 equipment orders and that “Full year 2026 Gas orders pricing per kW will be approximately 50% higher than full year 2025 orders”. He also warned that fourth-quarter pricing per kW would be lower than the third quarter’s, with fewer aeroderivatives and more 50Hz units.
- Power services orders rose +12% organically against +304% for equipment orders, so the margin gain came from equipment price and volume rather than services. Management says the services payoff comes later, as the installed base grows into the 2030s.
The Bull and Bear Case for GE Vernova Shares
- The bull case is price and backlog. Gas orders carry about 50% higher pricing per kW than a year ago, and equipment backlog of $104.1 billion passed services backlog of $92.7 billion for the first time in the seven quarters shown on page 28. Power’s 21.4% EBITDA margin is near its 2028 target of 22%, and with $13.9 billion of net cash the board doubled the buyback authorization to $20 billion.
- The bear case is where the cash comes from. Most of the year’s free cash flow is customer deposits, and 2025 and 2026 together cover 89.6% to 94.1% of a target meant to span four years. Deposits turn into revenue without new cash as turbines ship, which is why the implied fourth quarter drops to a third or less of the run rate.
From the GE Spin-Off to a Four-Year Cash Target
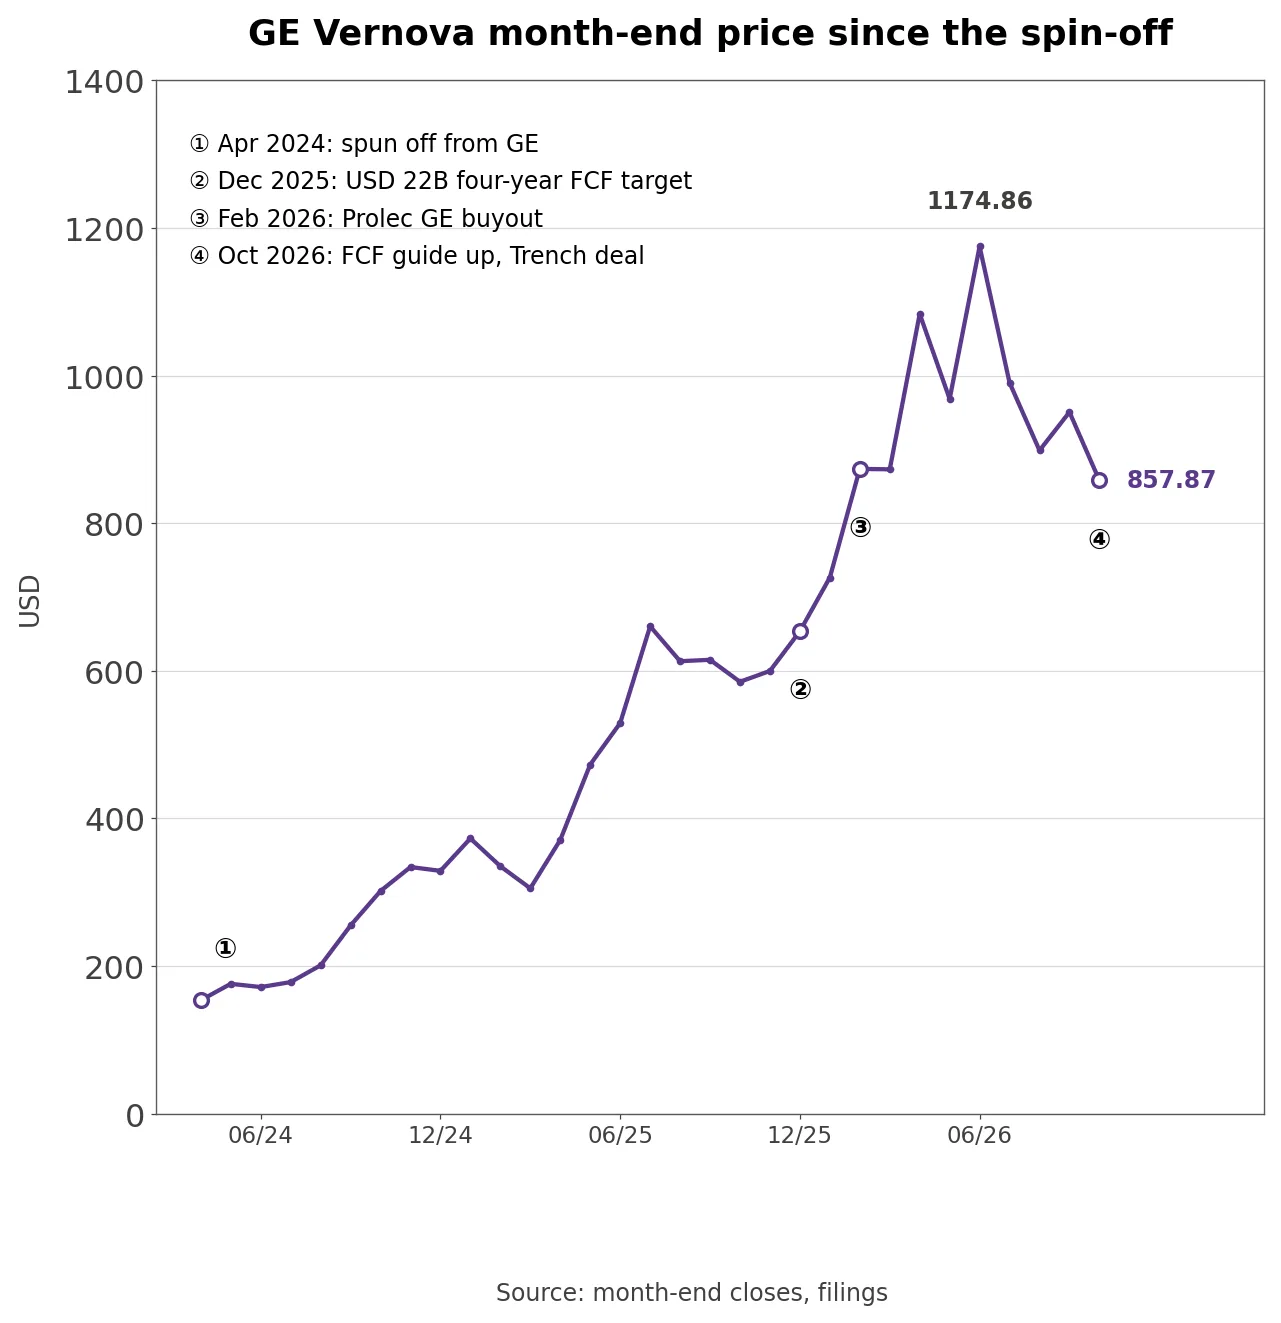
- GE completed the distribution of GE Vernova shares on April 2, 2024, and the first month-end close was $153.71. Free cash flow was $1.701 billion in 2024 and $3.710 billion in 2025. At the December 2025 investor update, management lifted its 2025 to 2028 cumulative free cash flow target from $14 billion to at least $22 billion and set 2028 goals of at least $52 billion of revenue and a 20% EBITDA margin. Parks said he expected “progress collections to continue to be a cash source given the robust demand environment”.
- Margins have stepped up toward that goal. Revenue grew from $34.935 billion in 2024 to $38.068 billion in 2025, and the adjusted EBITDA margin rose from 5.8% to 8.4%. Guidance for 2026 is 13.5% to 14.5%, and the 2028 target is 20%.
- The balance sheet grew quickly in 2026. On February 2 the company paid $5.254 billion in cash for the remaining 50% of Prolec GE, its North American transformer joint venture with Xignux, and booked the $3.992 billion remeasurement gain. On February 4 it issued $2.6 billion of senior notes, and in August Fitch raised its rating to A- from BBB+.
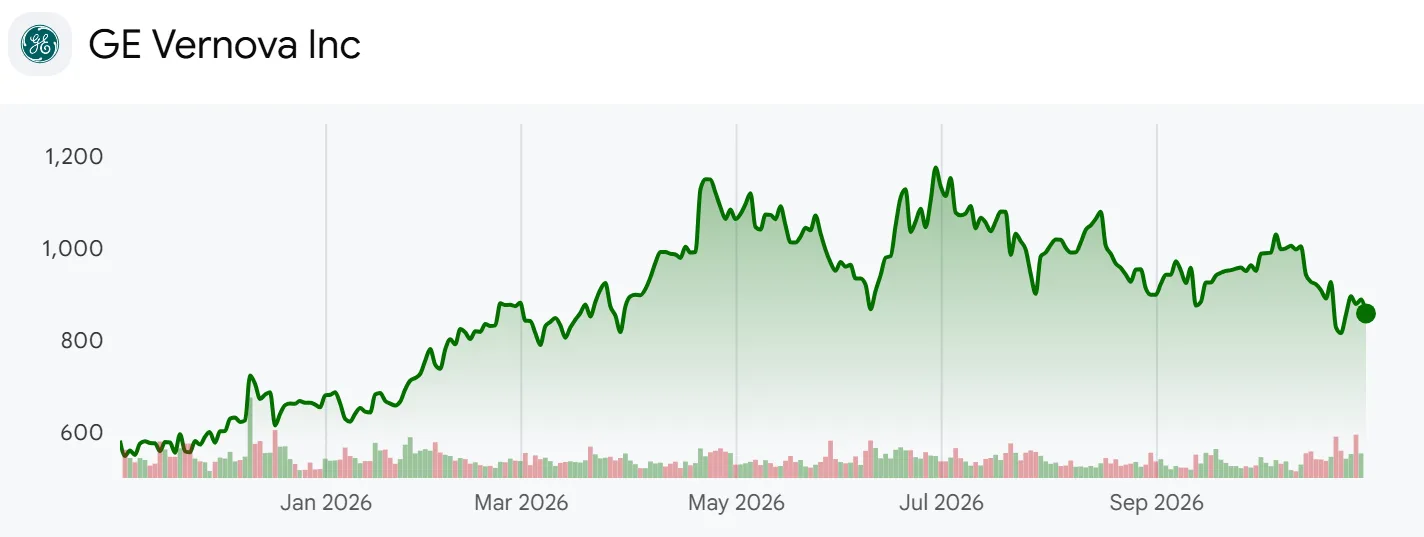
- The share price climbed from $653.57 at the end of 2025 to a month-end high of $1,174.86 in June 2026 and now sits -27.0% below that. It fell -11.5% the week before the Q3 report and rose +5.3% in the week of the report. The 15.6 million shares repurchased since December 2024 cost about $635 each on average.
How Much of the Cash Came From Customer Deposits?
- Own calculation (Q3 2026 10-Q): Without the $19.511 billion increase in contract liabilities, nine-month operating cash flow of $16.737 billion would have been negative $2.774 billion. Over the same nine months the company paid $2.681 billion of income taxes, and inventories and receivables absorbed $2.052 billion and $1.667 billion.
- Contract liabilities are customer down payments and progress collections received ahead of delivery. The balance rose +76.3% from $25.950 billion at the end of 2025 to $45.747 billion in September, 2.84 times the $16.115 billion of March 2024, and current contract liabilities alone equal 53.0% of total assets of $86.220 billion. The 10-Q attributes the increase to collections in excess of revenue recognition and the Prolec GE acquisition.
- The quarterly pattern is consistent. Over the four quarters from Q4 2025, operating cash flow totaled $19.216 billion while contract liabilities grew $25.111 billion and adjusted EBITDA came to $5.247 billion. Excluding deposits, operating cash flow was negative in three of those four quarters.
- Set against the four-year target, 2025 free cash flow of $3.710 billion plus 2026 guidance of $16 billion to $17 billion gives $19.71 billion to $20.71 billion, or 89.6% to 94.1% of the $22 billion. On the target as stated, 2027 and 2028 together need only $1.29 billion to $2.29 billion, against 2028 EBITDA of about $10.4 billion implied by the company’s own $52 billion revenue and 20% margin goals.
Gas Turbine Gigawatts and the Production Rate
- The deposits rest on gas equipment under contract. Strazik said gigawatts in backlog plus slot reservation agreements rose from 83 GW at the start of 2026 to 116 GW in Q2 and 122 GW in Q3, with at least 130 GW expected by year-end. The company shipped 5 GW in Q3 while signing 11 GW, and said “backlog is now greater than our SRA balance”.
- A slot reservation agreement holds a production slot in exchange for a payment, and converts to a firm order later. Q3 converted 13 GW of reservations into orders, lifting Power equipment orders +304% to $17.973 billion. The customer base is about 100 customers in 25 countries, roughly 80% traditional utilities and power producers and 20% data centers.
- Own calculation (December 2025 investor update and Q3 call): Management planned to reach “a run rate of 20GW annualized by the third quarter of 2026”, and Q3 shipments of 5 GW match it. At that rate, 122 GW under contract equals 6.1 years of output and the 130 GW year-end goal equals 6.5 years.
- New deposits keep coming in while contracts outpace shipments, and the balance starts to shrink into revenue once shipments overtake new signings. Management expects gigawatts under contract and Gas Power equipment backlog to keep growing in 2027, and the HA fleet running or on contract to reach at least 400 units by the end of 2027.
How GE Vernova Makes Money
- Nine-month revenue of $33.084 billion split 49.9% Power, 31.6% Electrification and 18.7% Wind. Q3 revenue of $12.642 billion was $8.340 billion of equipment and $4.302 billion of services, and most of the $92.7 billion services backlog is long-term maintenance on installed equipment. The company has about 85,000 employees in about 100 countries.
- Power sells gas turbines and steam, nuclear and hydro equipment, then earns parts and service revenue for decades. Management says its installed base produces over half of US electricity on any given day and a third of the world’s outside China. Q3 Power revenue was $6.067 billion (+24.8%) with EBITDA of $1.297 billion. In nuclear, the GE Vernova Hitachi BWRX-300 small modular reactor is under construction at Ontario Power Generation’s Darlington site.
- Electrification makes transformers, switchgear, HVDC transmission systems and grid software. Q3 revenue of $3.862 billion rose +50.6%, but $945 million came from acquisitions, mostly Prolec GE, leaving organic growth of +16%. Prolec GE has about 10,000 employees at seven plants in the Americas, five in the US, and is expected to add about $3.1 billion to 2026 Electrification revenue of $14.5 billion to $15.0 billion. Equipment backlog reached $42.2 billion, up 60% including $5 billion from Prolec GE. Revenue is mostly equipment, $3.377 billion against $485 million of services, and the 19.1% EBITDA margin compares with guidance of 18% to 20%. Orders fell organically against a year-earlier quarter that included large synchronous condenser orders.
- Wind posted Q3 revenue of $2.741 billion, $2.468 billion of it onshore, and EBITDA of $72 million, a turn from a loss. The company expects full-year Wind EBITDA losses of $400 million to $500 million and settled all Vineyard Wind litigation in Q3. Onshore repower orders, which upgrade older turbines, rose to 481 units from 139.
- In October GE Vernova agreed to buy Trench Group, a maker of high-voltage bushings, instrument transformers and coils, for $9.0 billion, or 13 times projected 2028 adjusted EBITDA, funded about half with cash and half with debt and expected to close late in 2027. Trench already supplies GE Vernova, which buys most of its bushings externally today. The deck projects Trench revenue of $1.4 billion in 2026 rising to $1.9 billion in 2028 and adjusted EBITDA of $0.5 billion rising to $0.7 billion. The company has also committed $6 billion of capex from 2025 to 2028, including $1 billion for Prolec GE, and $5 billion of R&D; nine-month capex of $1.43 billion was 2.4 times the prior year.
GE Vernova vs Eaton Vertiv Caterpillar and Bloom Energy
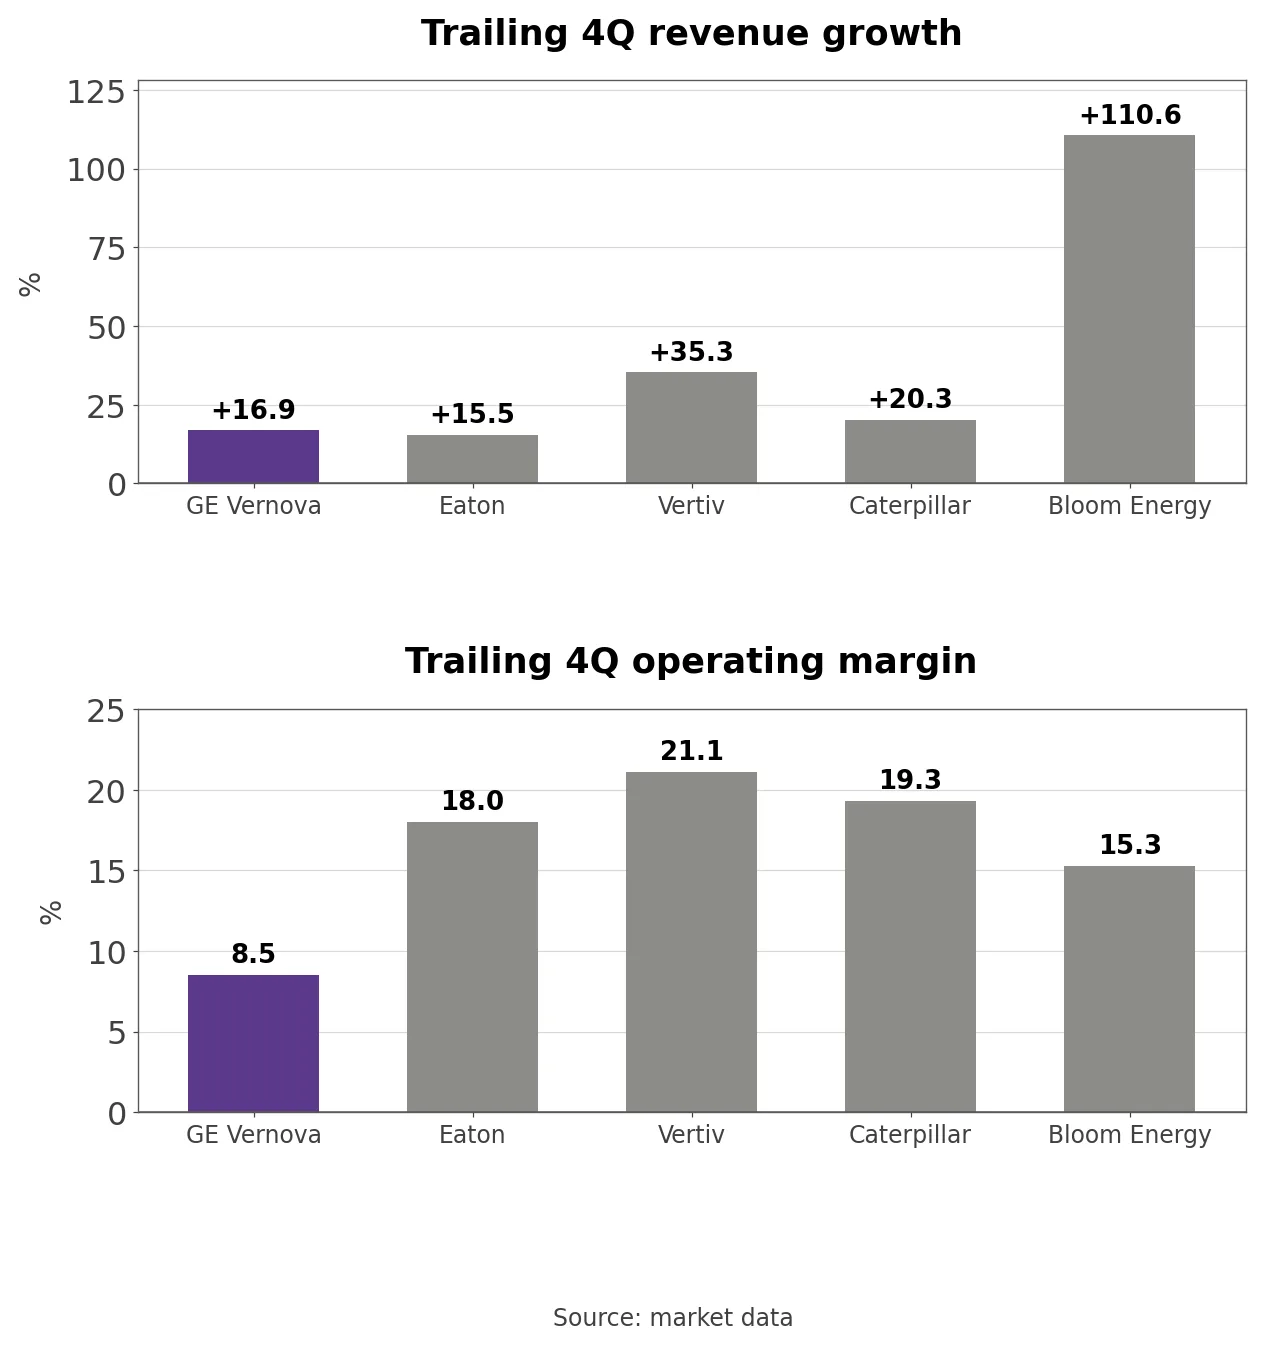
- Siemens Energy and Mitsubishi Heavy Industries, the direct gas turbine rivals, lack US market data, so the comparison uses Eaton in grid equipment, Vertiv in data center power, Caterpillar in gas gensets and Bloom Energy in on-site fuel cell power. On market data, TTM revenue growth was +16.9% at GE Vernova, +15.5% at Eaton (through June), +35.3% at Vertiv, +20.3% at Caterpillar and +110.6% at Bloom Energy.
- GE Vernova’s 8.5% operating margin is the lowest of the five; the others range from 15.3% to 21.1%. Nine-month Wind EBITDA losses of $585 million and $650 million of intangible amortization weigh on GAAP operating income, while Power alone ran a 21.4% EBITDA margin in Q3. Over a year, market value changed +44.0% at GE Vernova, +89.9% at Bloom Energy, +17.5% at Vertiv, +4.4% at Caterpillar and -4.8% at Eaton.
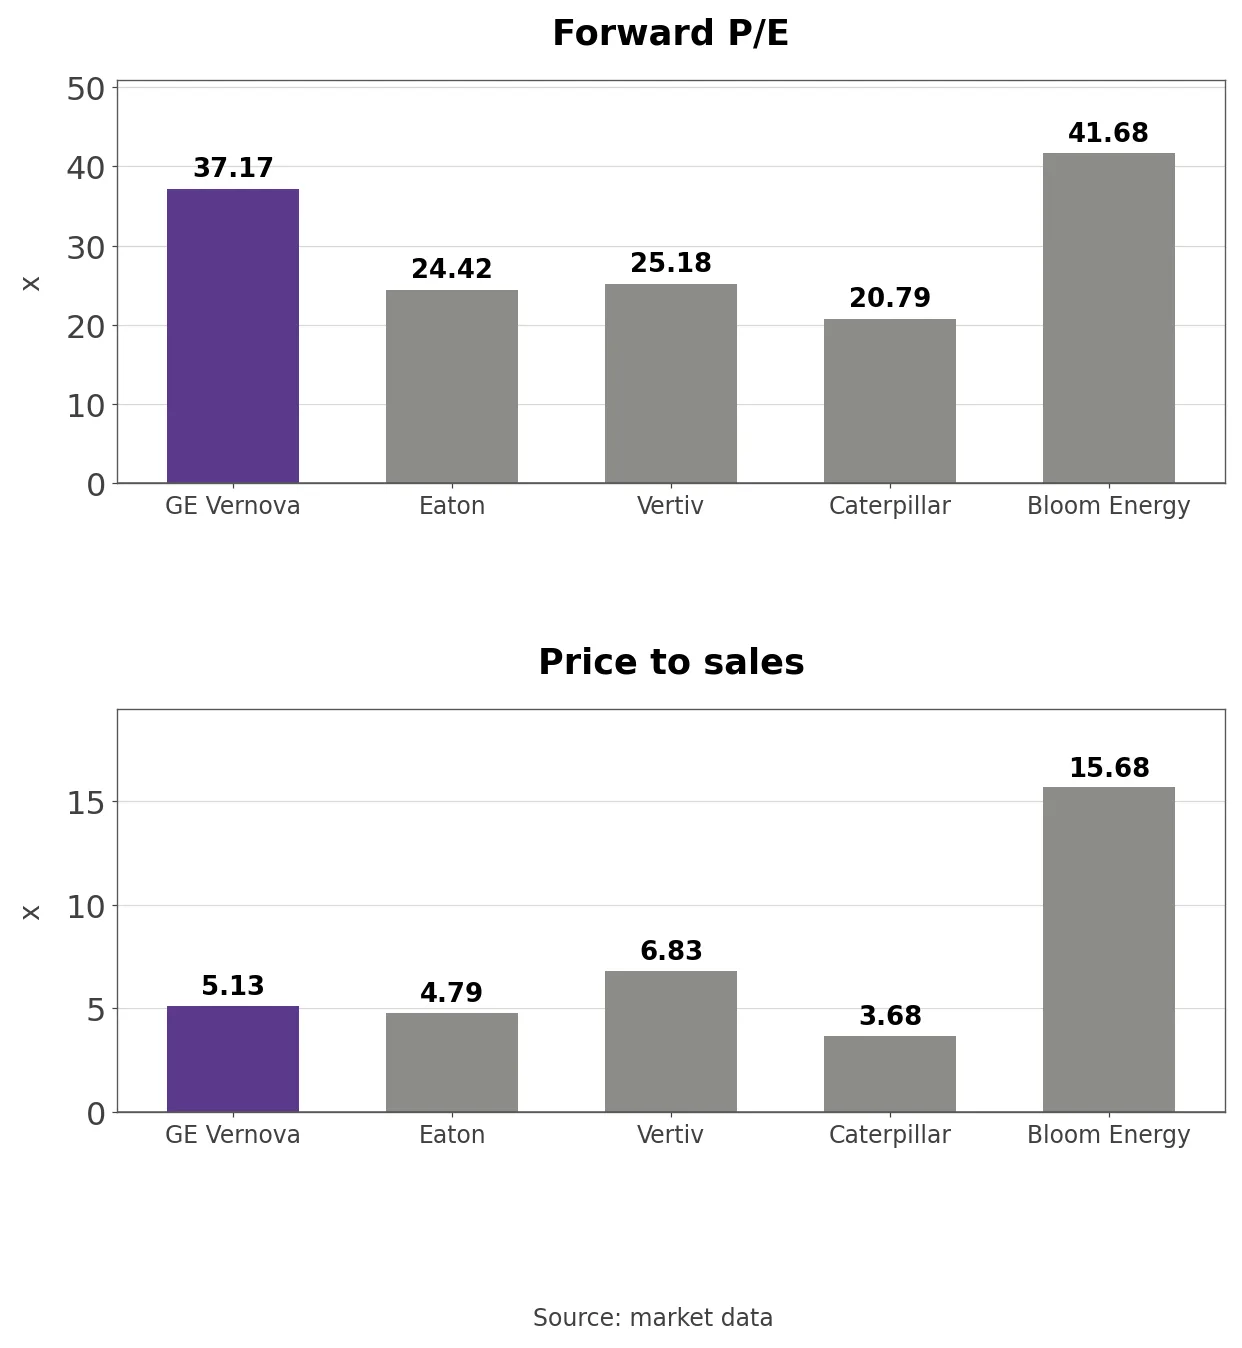
- The forward P/E of 37.17 is second to Bloom Energy’s 41.68, with Eaton, Vertiv and Caterpillar at 20.79 to 25.18. Price to sales of 5.13 sits below Bloom Energy’s 15.68 and Vertiv’s 6.83 and above Eaton’s 4.79 and Caterpillar’s 3.68. Caterpillar overlaps most directly, selling gas gensets and small turbines into the same data center market where GE Vernova booked 57 aeroderivatives in Q3.
GE Vernova’s Price-to-Sales and EV-to-EBITDA Band
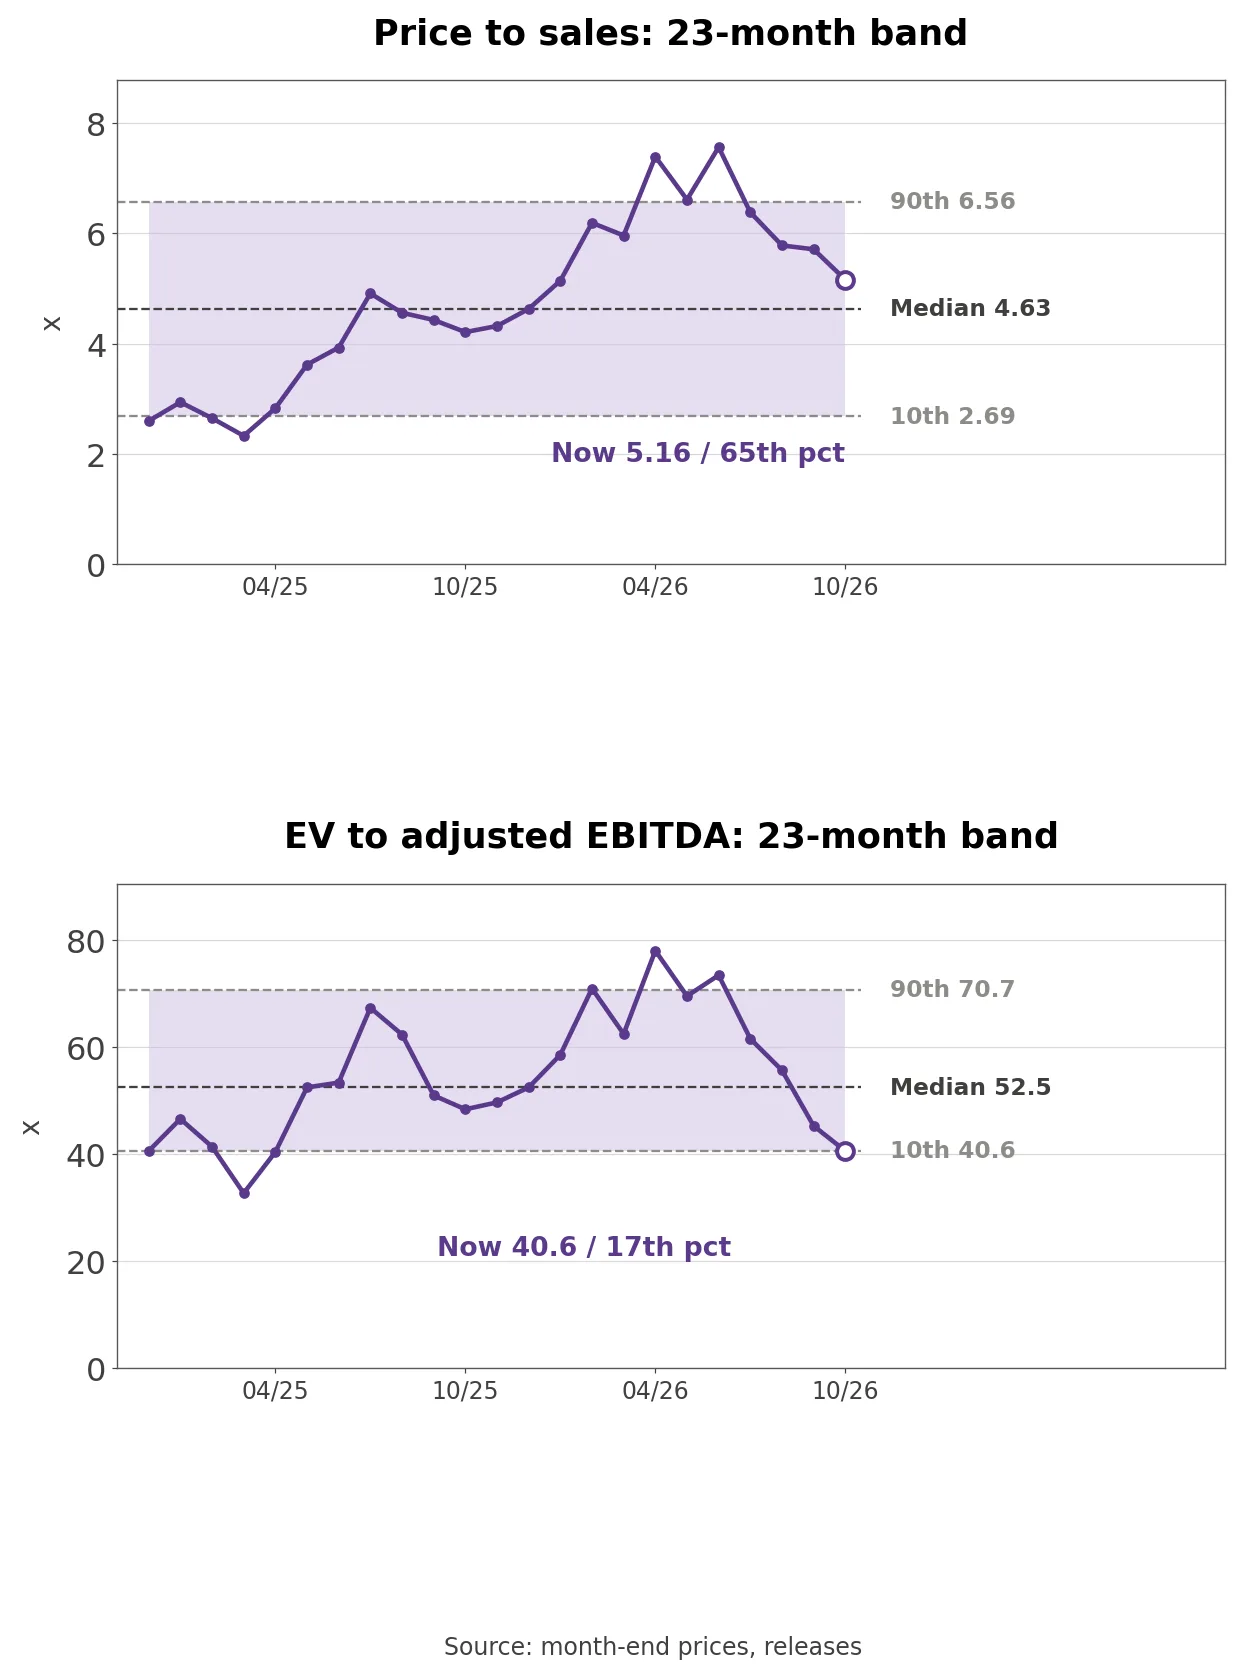
- The spin-off leaves 23 months of trailing four-quarter data, starting in December 2024. P/E is left out because the Prolec GE gain puts the trailing P/E at 22.42 against a forward P/E of 37.17.
- Price to sales is 5.16, in the 65th percentile of 23 months against a median of 4.63. Enterprise value of $213.1 billion, after $13.9 billion of net cash, is 40.6 times TTM adjusted EBITDA of $5.247 billion, in the 17th percentile against a median of 52.5 and a high of 78.1. The two multiples point in opposite directions, and margin expansion explains the gap. Market value is 13.8 times the $16.5 billion midpoint of 2026 free cash flow guidance, and enterprise value is 20.5 times the $10.4 billion of 2028 EBITDA implied by the company’s targets.
Three Conditions That Move the Stock
- Contract liabilities show whether cash keeps running ahead of profit. If the balance keeps rising in Q4 and 2027 as new deposits outpace shipments, free cash flow stays above adjusted EBITDA. If it starts to fall from $45.7 billion, revenue can grow while cash lags EBITDA, and the four-year target becomes a ceiling rather than a floor.
- Gas gigawatts and pricing per kW drive the deposits. Passing 130 GW by year-end at 2026 pricing locks in more than six years of output at higher margins. Repeated quarters of lower pricing per kW, or slower conversion of reservations into orders, would cut into both deposits and margins.
- Electrification margins and Trench funding test the second growth engine. An EBITDA margin moving toward the top of the 18% to 20% range with net cash intact after Trench adds a real second leg. Falling orders and debt-funded buybacks slowing would undercut it.
What to Watch in the December Quarter
- The fourth-quarter report, likely in late January, should show whether free cash flow lands inside the implied $0.69 billion to $1.69 billion, whether contract liabilities grew from $45.7 billion and whether gas contracts passed 130 GW. Parks has guided to “growth in revenue and adjusted EBITDA, adjusted EBITDA margin expansion, and positive free cash flow” for the quarter, and 2027 guidance will show the gap between free cash flow and EBITDA.
- One question stays open. Management set a four-year target of $22 billion and said deposits would keep funding cash, then covered most of it in a single year. In 2027 guidance, will it raise the cash target again, or treat 2027 as the year shipments start to overtake deposits?
Related Analysis
- Oracle (ORCL) Stock Analysis: Cash Flow and Capex Gap: another company where customer prepayments carried operating cash flow, a useful parallel for judging how durable GE Vernova’s deposit-funded cash is.
- Dell (DELL) Stock Analysis: Q2 FY2027 Earnings and Guidance: the AI data center buildout seen from the server side, the same demand behind the 20% of gas turbine customers that are data centers.