Alphabet (GOOGL) Stock: Equity Raise and Cloud Up 103%
Contents
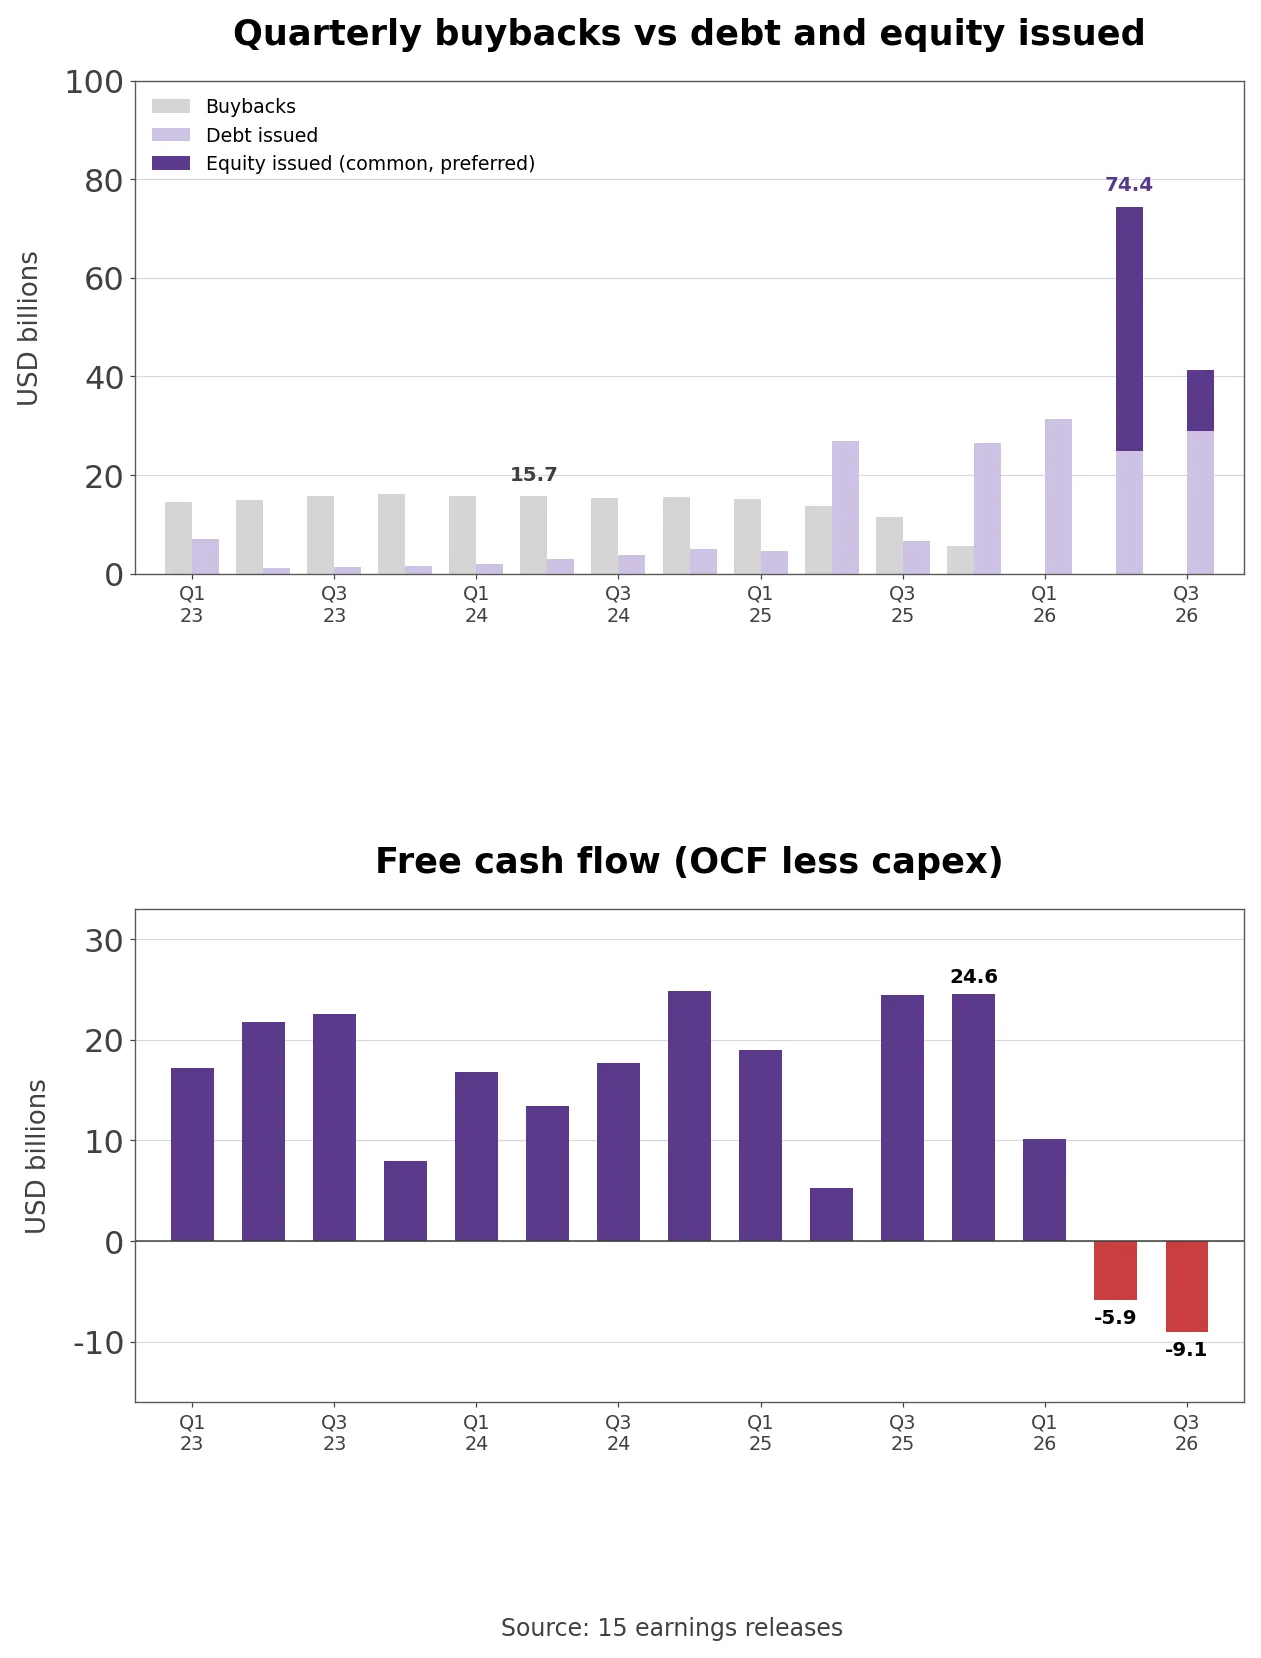
- Alphabet (NASDAQ: GOOGL) bought back no stock in the third quarter of 2026. It sold $12.4 billion of new common shares and raised $29.0 billion of debt instead, and capital expenditures of $51.36 billion ran ahead of operating cash flow of $42.29 billion, leaving free cash flow at -$9.07 billion after -$5.86 billion in the second quarter.
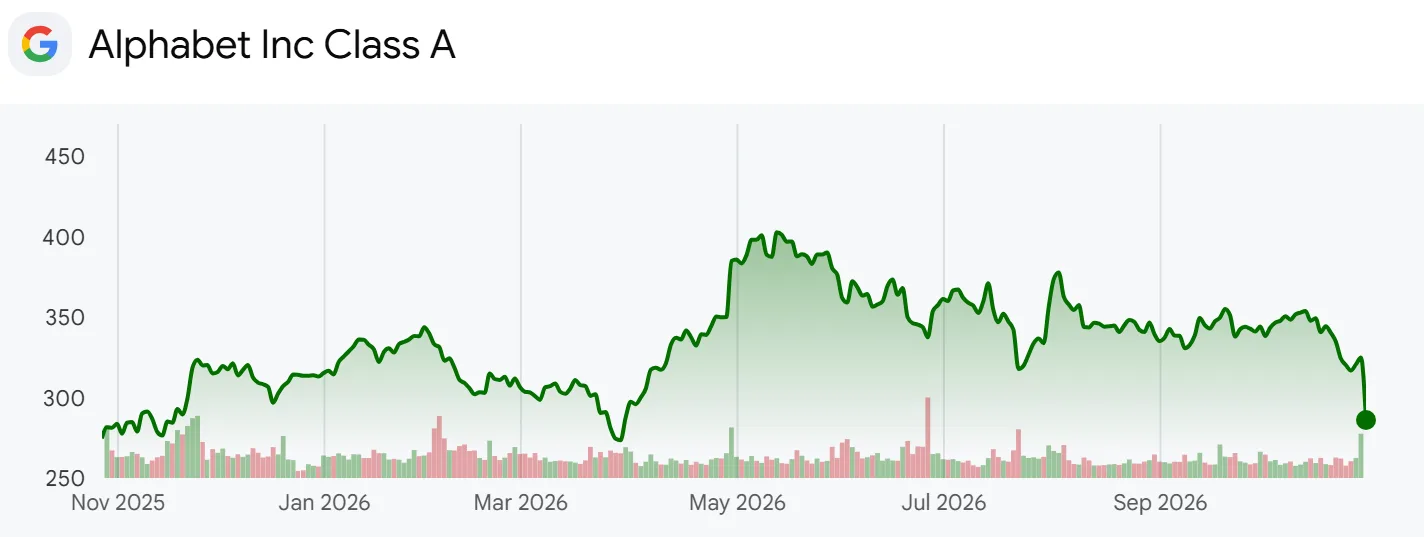
- The company behind Google Search, YouTube, Android and Google Cloud closed at $324.89 when it reported results, for a market value of about $3.99 trillion on 12.29 billion shares. The next morning the stock opened at $286.88, -11.7%.
- The question is whether Google Cloud’s $567.7 billion revenue backlog turns into revenue fast enough to carry a 2026 capex budget of $195 billion to $205 billion and the $84.75 billion equity raise announced in June. The analysis works from the Q3 earnings release, the Q3 10-Q, the June equity raise 8-K, the Q3 earnings slides, the Google Cloud strategy deck from September and 32 quarterly releases going back to the December 2018 quarter.
- Two caveats apply. P/E here strips out the effect of gains and losses on equity securities that Alphabet itself discloses in a footnote every quarter, because $8.21 of the trailing four-quarter GAAP diluted EPS of $19.16 came from those gains. The Q3 call transcript was not available in English, so management commentary comes from the July call and is paraphrased.
What the Q3 Slides Show About Cloud and Capex
- Slide 3 of the Q3 earnings deck lists the models Alphabet shipped between July and October: Gemini 3.6, 3.7 and 3.8 Flash, Gemini 4 Argon and Carbon, the image model Nano Banana 2.1 and the music model Lyria 3.5. Slide 4 puts revenue growth of 25% next to a half-trillion-dollar run rate, about 32 billion tokens a minute across first-party models (up 40% from the prior quarter), more than one billion monthly Gemini app users, and Search revenue growth of 12% with the fastest growth in Search queries in five years.
- Sundar Pichai opened the release with “We had a strong quarter and are now on a half-trillion dollar revenue run rate.” He also said demand for TPU systems is strong across a wide range of customers.
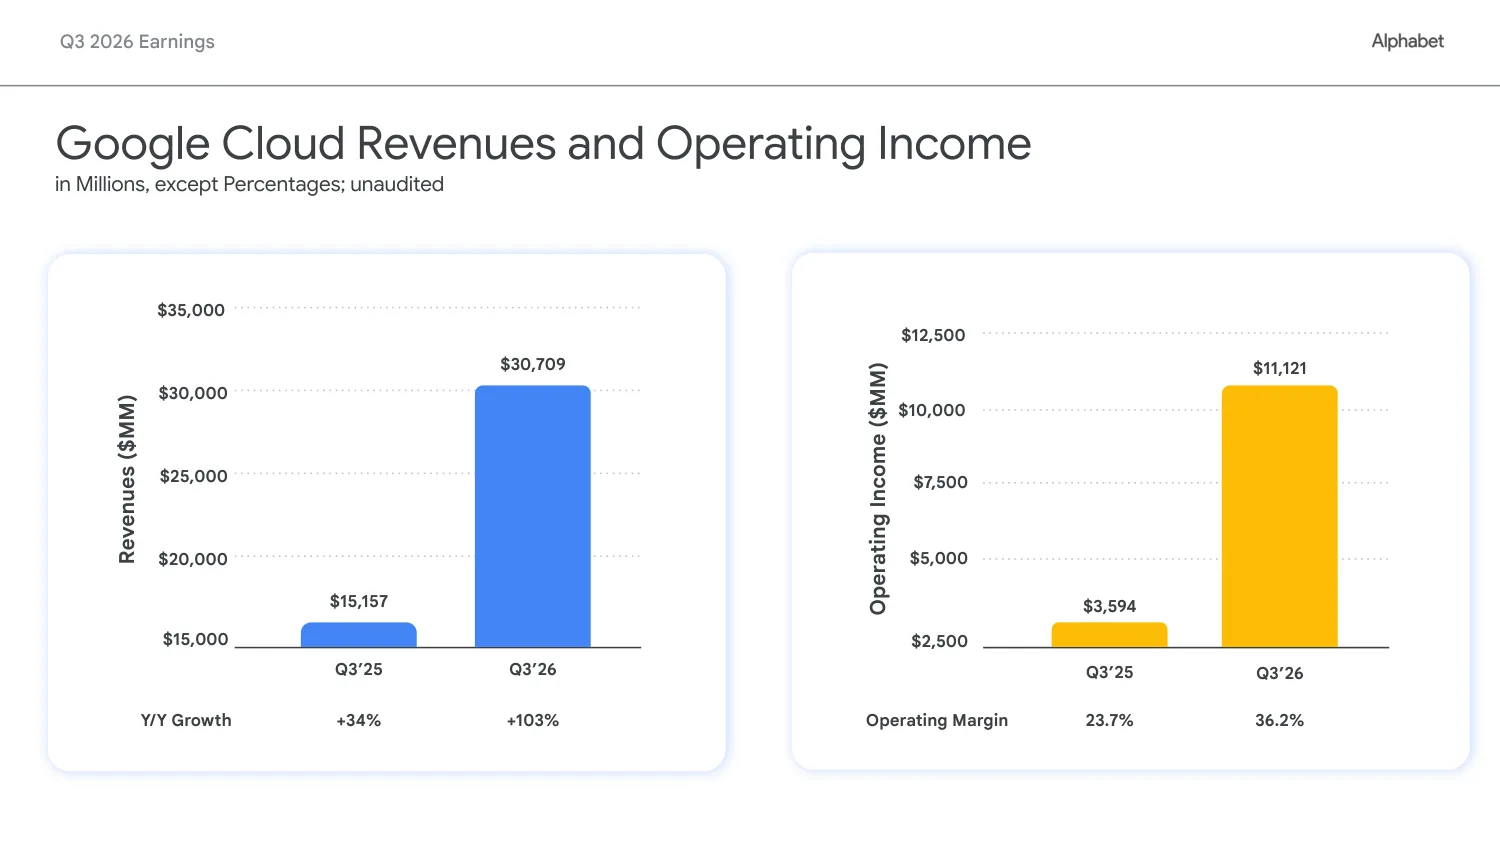
- Slide 9 isolates Google Cloud. Revenue doubled from $15.16 billion to $30.71 billion and operating income more than tripled from $3.59 billion to $11.12 billion, lifting the margin from 23.7% to 36.2%. The release adds that “TPU systems sales were also a meaningful contributor to revenue growth.” According to the 10-Q, those are product sales of hardware, software and installation delivered into customer data centers.
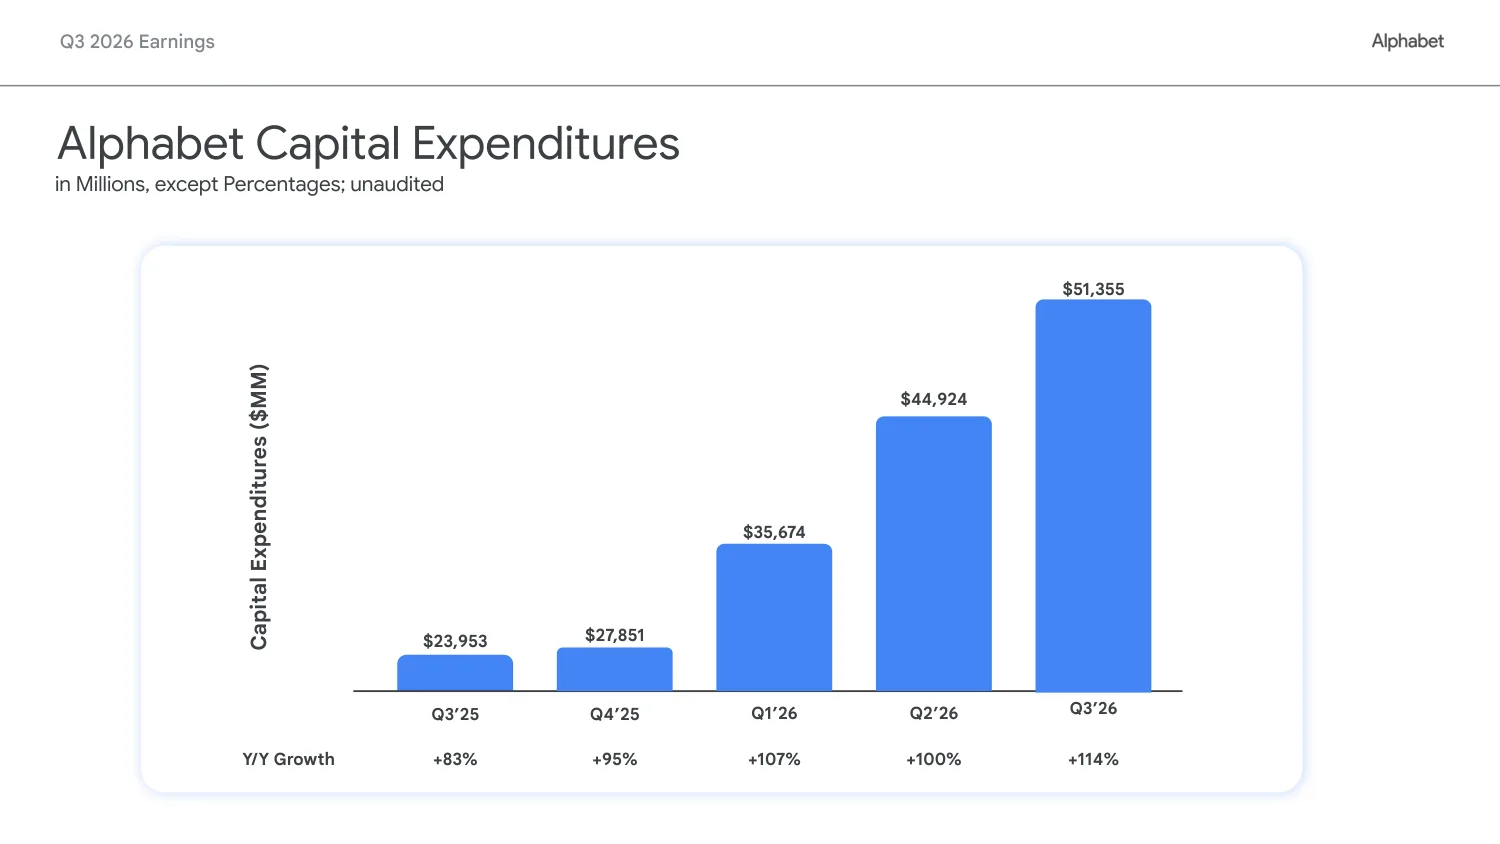
- Slide 11 charts five quarters of capex: $23.95 billion, $27.85 billion, $35.67 billion, $44.92 billion and $51.36 billion, with year-over-year growth climbing from 83% to 114%. Slide 12 lists free cash flow for the same quarters, negative in the last two, and trailing twelve-month free cash flow down from $73.55 billion to $19.75 billion, -73%.
- Slide 10 explains what a TPU system sale actually ships. A tray holds four proprietary chips on one liquid-cooled board, a rack holds 16 TPU machines with battery backup, and a pod ties 144 racks to three optical switch racks. High-bandwidth memory, optical circuit switches, software for JAX and PyTorch, inference engines and post-sales support and warranty come in the same package.
- Company disclosure (Q3 earnings release): Alphabet sold 12 million Class A shares for $4.3 billion and 24 million Class C shares for $8.1 billion through its at-the-market program during the quarter, issued senior unsecured notes for net proceeds of $28.7 billion, and in October declared a quarterly dividend of $15.63 per share on each series of its mandatory convertible preferred stock.
What the Google Cloud Deck Says About Contracts and Payback
- Google Cloud CEO Thomas Kurian presented a strategy deck at a Goldman Sachs conference on September 8. Slide 6 states that the majority of AI infrastructure total contract value is committed five-year contracts and that the AI server payback period is two years, a blended average of AI infrastructure and AI solutions that excludes TPU system sales.
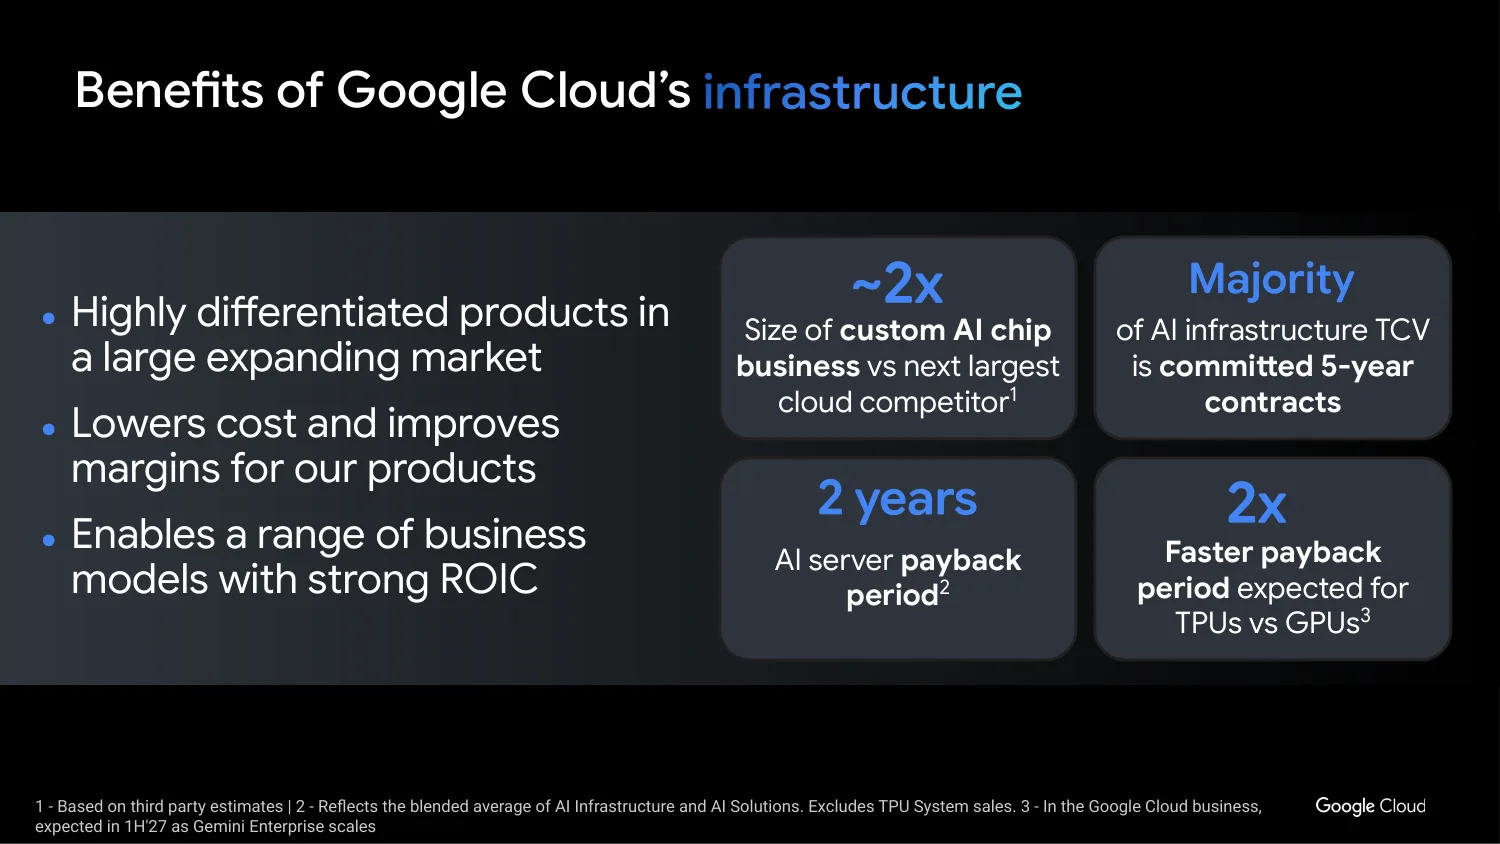
- The other two boxes on the slide are expectations. Alphabet expects TPUs to pay back twice as fast as GPUs in the cloud business, an estimate tied to Gemini Enterprise scaling in the first half of 2027, and it cites third-party estimates that its custom AI chip business is about twice the size of the next largest cloud competitor’s.
- Slide 4 sizes the business. Based on second-quarter annualized revenue, 17 Google Cloud product lines bring in more than $1 billion a year. Customers have consumed more than 50% above their commitments on average, new customer additions more than doubled from a year earlier, and deals worth $100 million to $1 billion more than doubled in both number and value. Slide 5 claims the eighth-generation TPU delivers up to 2.7 times the training price-performance of the seventh and 80% better inference price-performance.
- On the July call, CFO Anat Ashkenazi said the cloud backlog stood at $514 billion, mostly general GCP contracts, with more than half expected to be recognized within 24 months. She said most revenue from TPU system sale contracts lands in 2027, that Alphabet planned to use more third-party capacity in the third quarter while its own capacity was short, with some near-term margin pressure, and that 2026 capex guidance rose from $180 billion to $190 billion to a new $195 billion to $205 billion.
- Own calculation (Q3 10-Q and July call): Nine-month capex of $131.95 billion leaves $63 billion to $73 billion for the fourth quarter under that guidance. Recognizing just over 55% of the $567.7 billion backlog within 24 months implies about $312 billion, or roughly $156 billion a year, 1.7 times Google Cloud’s trailing four-quarter revenue of $93.17 billion. Cloud backlog rose from $513.9 billion to $560.8 billion in the quarter; adding back Q3 cloud revenue of $30.71 billion implies about $77.6 billion of new commitments, 2.5 times what the segment billed.
The Bull and Bear Case for Alphabet Shares
- The bull case rests on cloud speed. Google Cloud revenue grew +102.6% with a 36.2% margin, the backlog is up +260% from $157.7 billion a year ago, and EPS excluding equity securities rose +21.9% to $2.67 in Q3. The company’s own payback figure for AI servers is two years.
- The bear case rests on where the cash comes from. Free cash flow has been negative for two quarters, buybacks are zero, the share count is up 1.7% in nine months, and the preferred stock costs about $1.2 billion a year in dividends. Capex is set to rise again in 2027, and on earnings excluding equity gains the stock trades at 29.67 times, above its five-year median.
From Buybacks to New Shares and Debt
- Alphabet spent $328.55 billion on buybacks from 2019 through 2025, rising from $18.40 billion in 2019 to $61.50 billion in 2023 and $62.22 billion in 2024. Diluted shares fell from 13.90 billion in the fourth quarter of 2019 to a low of 12.20 billion in the second quarter of 2025, and in April 2025 the board authorized another $70 billion of repurchases.
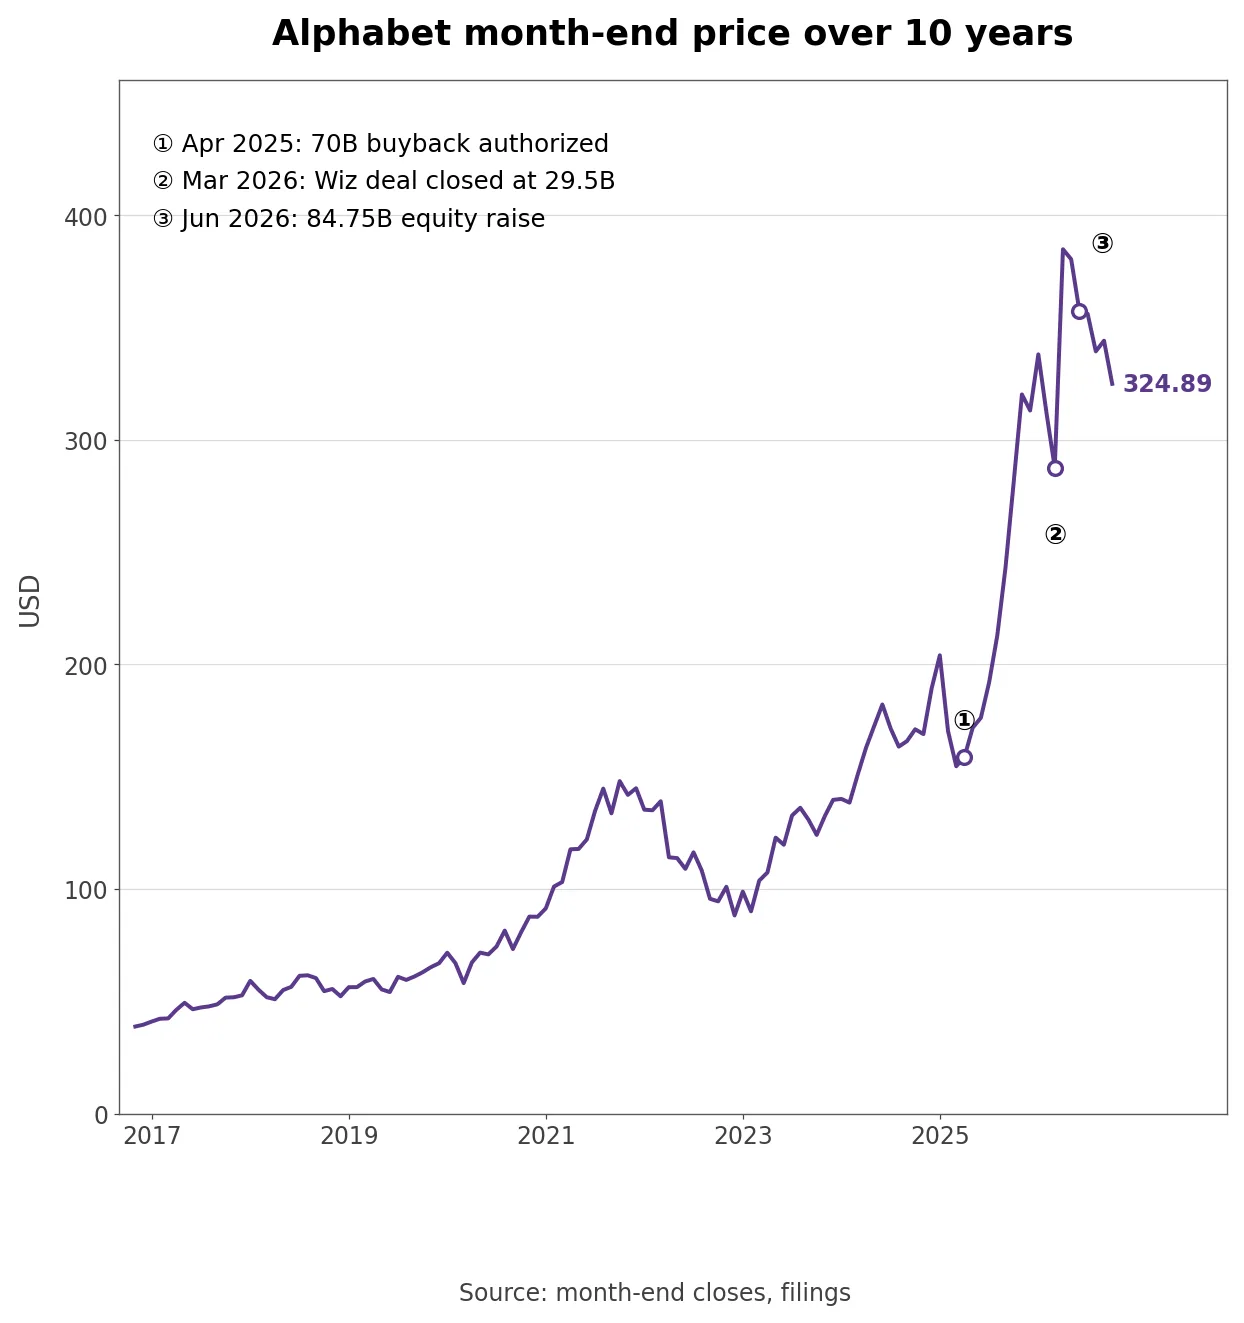
- The direction changed in the second half of 2025. Quarterly buybacks fell to $11.50 billion in Q3 and $5.50 billion in Q4, then to zero in 2026. Alphabet closed its $29.5 billion acquisition of security company Wiz on March 11, 2026, and on June 1 announced an $80 billion equity raise, upsized the next day to $84.75 billion. Berkshire Hathaway took $10 billion in a private placement, and the release notes that “This investment by Berkshire Hathaway adds to the position it has built since Q3 2025.”
- Debt grew in parallel. The June release said Alphabet had raised more than $85 billion of debt in six currencies over the prior year, taking total debt above $100 billion, and long-term debt reached $125.10 billion at September 30, up +168.8% from $46.55 billion at the end of 2025. It described the raise this way: “This equity offering is part of Alphabet’s plan to fund its investments in a balanced way while retaining a healthy balance sheet.” On the July call Ashkenazi said the company had no plans to return to the equity market for now, apart from at-the-market sales tied to employee stock taxes.
How Much Dilution Does the Equity Raise Add?
- The $84.75 billion has four parts: $18 billion of common stock, $16.75 billion of mandatory convertible preferred stock, a $40 billion at-the-market program and the $10 billion Berkshire placement. The common offering sold 25,459,689 Class A shares at $355.20 and the same number of Class C shares at $351.80, and underwriters exercised their options in full for 29,278,642 of each. With its option also exercised, the preferred offering reached 385 million depositary shares, or $19.25 billion.
- Filing note (Q3 10-Q): Net proceeds were $20.5 billion from the public offering, $10.0 billion from the private placement and $19.0 billion from the preferred stock, plus $12.4 billion from the ATM in Q3, with $27.6 billion of ATM capacity left. The 10-Q states that “The proceeds from offerings under the ATM Program are primarily intended to be used to meet tax obligations associated with employee equity grants.” The June release put that use at about $30 billion for calendar 2026.
- The preferred stock pays 6.25% a year and converts automatically on May 15, 2029. Each Series A preferred share becomes 2.2520 to 2.8160 Class A shares and each Series B share 2.2740 to 2.8420 Class C shares, adding roughly 43.6 million to 54.5 million common shares, 0.35% to 0.44% of the September count. Alphabet paid $1.0 billion for capped calls to offset dilution up to $532.67 for Class A and $527.80 for Class C, 50% above the offering prices.
- Own calculation (Q3 release and 10-Q): Equity raised in the first nine months of 2026 totals $61.93 billion, $42.87 billion of common and $19.06 billion of preferred, against $39.81 billion spent on buybacks in the same months of 2025. Shares outstanding rose from 12.088 billion to 12.294 billion, +1.7%, and Q3 diluted weighted shares of 12.368 billion were up 1.4% from a year earlier.
- The ATM changes how employee stock taxes are paid. Alphabet used to withhold shares when awards vested and pay the tax in cash; those net payments reached $17.42 billion in nine months against $9.00 billion a year earlier. Selling shares in the market to cover the same tax keeps that cash in the company but adds to the share count.
Negative Free Cash Flow and a Bigger Debt Load
- Third-quarter operating cash flow fell -12.6% to $42.29 billion while capex rose +114.4% to $51.36 billion. Capex took 121.4% of operating cash flow, against 49.5% a year earlier.
- Capex returns as cost. Depreciation rose +49.2% to $8.37 billion in Q3, and on the July call Ashkenazi said depreciation and data center operating costs such as energy would keep weighing on the income statement. Quarterly capex is now 8.2 times its level of $6.29 billion in the first quarter of 2023, so higher depreciation will run for years.
- Debt did most of the funding. Alphabet issued $85.22 billion of debt in nine months and repaid $8.88 billion, a net $76.34 billion. Cash and marketable securities of $265.10 billion at September 30 were more than double the year-end figure, but they include $75.2 billion of SpaceX shares that are subject to short-term restrictions on sale. Total assets crossed $1 trillion, at $1.003 trillion.
How Alphabet Makes Money From Ads and Cloud
- Of Q3 revenue of $127.58 billion, Google Search and other brought $63.35 billion (49.7%), up 12.0%. YouTube ads added $11.21 billion (8.8%), up 9.2%, and Google Network, which places ads on partner sites, $7.46 billion (5.8%), up 1.4%. Subscriptions, platforms and devices, which covers YouTube Premium, Google One, Google Play and Pixel phones, brought $14.29 billion (11.2%), up 11.0%, and Google Cloud $30.71 billion (24.1%), up 102.6%.
- The 10-K describes the ad business as performance and brand advertising across Google Search, YouTube and Network partner properties. To keep those search access points, Google pays traffic acquisition costs (TAC) to browser providers, carriers, device makers and software developers, and to Network partners. Q3 TAC was $16.37 billion, 20.0% of ad revenue of $82.01 billion, against 20.1% a year earlier.
- Subscriptions are also counted by users. The June release said Alphabet had reached 350 million paid subscriptions, and the Q3 release counts more than 150 million YouTube Music and Premium subscribers including trials. The 10-K notes that Google One offers access to the most capable Gemini models, so consumer AI plans also land in this line.
- Google Cloud earns money from GCP infrastructure and AI solutions, Workspace and TPU system sales, recognized by consumption, over a subscription term or on delivery for product sales. Wiz now reports inside the segment. Kurian’s deck calls Google Cloud the only provider offering first-party products across the whole AI stack, from infrastructure and models to data, security, agents and applications. Other Bets earns revenue mainly from autonomous transportation and internet services and lost $2.05 billion in Q3.
- Segment profit comes from Services and Cloud. Google Services earned $39.16 billion with its margin up from 38.5% to 40.7%, and Cloud earned $11.12 billion. As the release puts it, “Alphabet-level activities primarily reflect expenses related to our shared AI research and development,” and that cost rose from $4.47 billion to $7.66 billion.
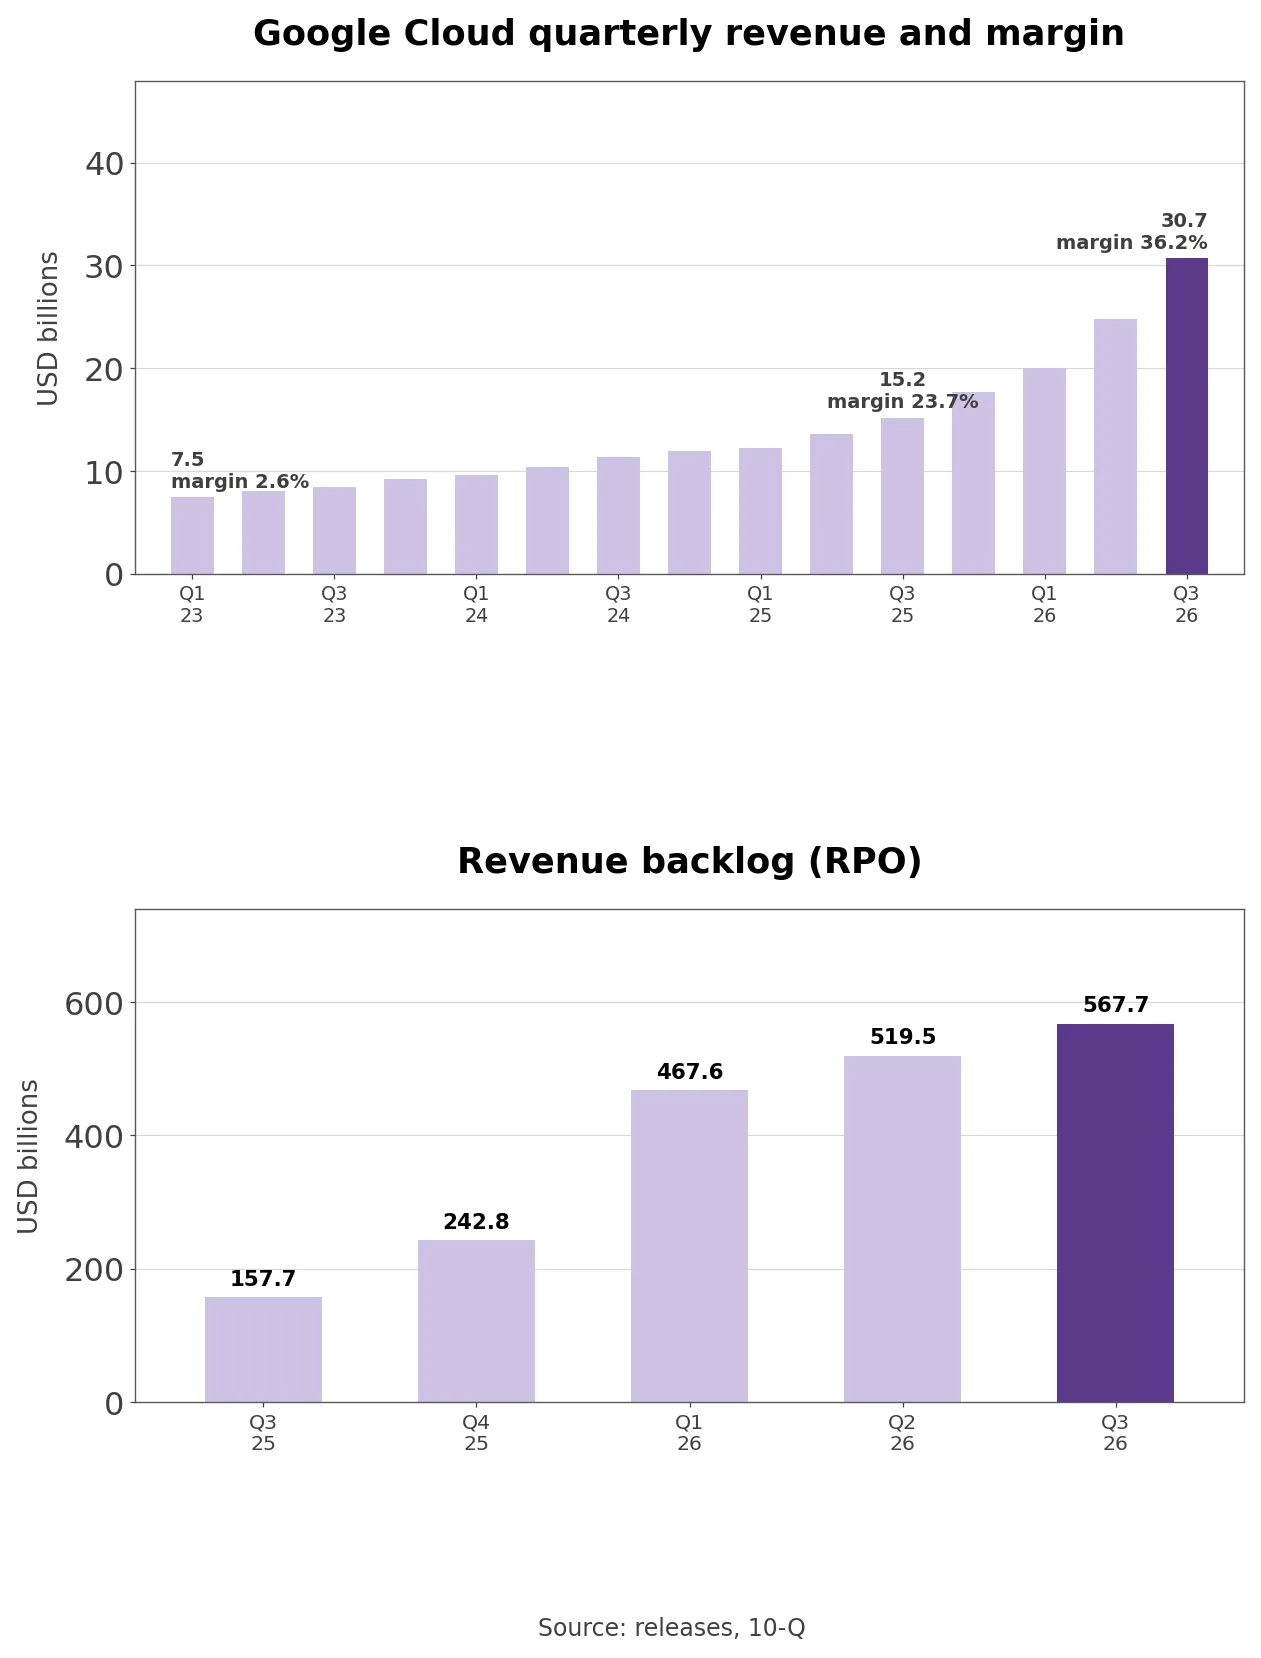
- Google Cloud lost $1.24 billion on revenue of $3.83 billion in the fourth quarter of 2020. It turned its first profit of $191 million in the first quarter of 2023 and earned $11.12 billion fourteen quarters later. The backlog went from $157.7 billion and $242.8 billion at the end of Q3 and Q4 2025 to $467.6 billion in Q1 2026, nearly doubling in one quarter, and $560.8 billion of the September total belongs to Cloud.
- Costs follow the buildout. Cost of revenues rose 24.3% to $51.42 billion, and other cost of revenues, everything except TAC, rose 32.3% to $35.05 billion; the 10-K lists YouTube content costs, infrastructure depreciation, device inventory and energy and network costs there. Inventory jumped 5.5 times to $13.31 billion, research and development rose 36.2% to $20.64 billion, and net property and equipment grew from $246.60 billion to $372.83 billion in nine months.
How Alphabet Compares With Three Big Tech Peers
- The peers are three U.S. large caps whose profits ride on the same AI data center buildout and the same ad and cloud demand. Microsoft sells Azure and Office, Amazon sells retail and AWS, and Meta sells ads and pours the proceeds into AI capacity. Market values are $3.97 trillion for Alphabet on market data, $3.94 trillion for Microsoft, $2.75 trillion for Amazon and $1.57 trillion for Meta.
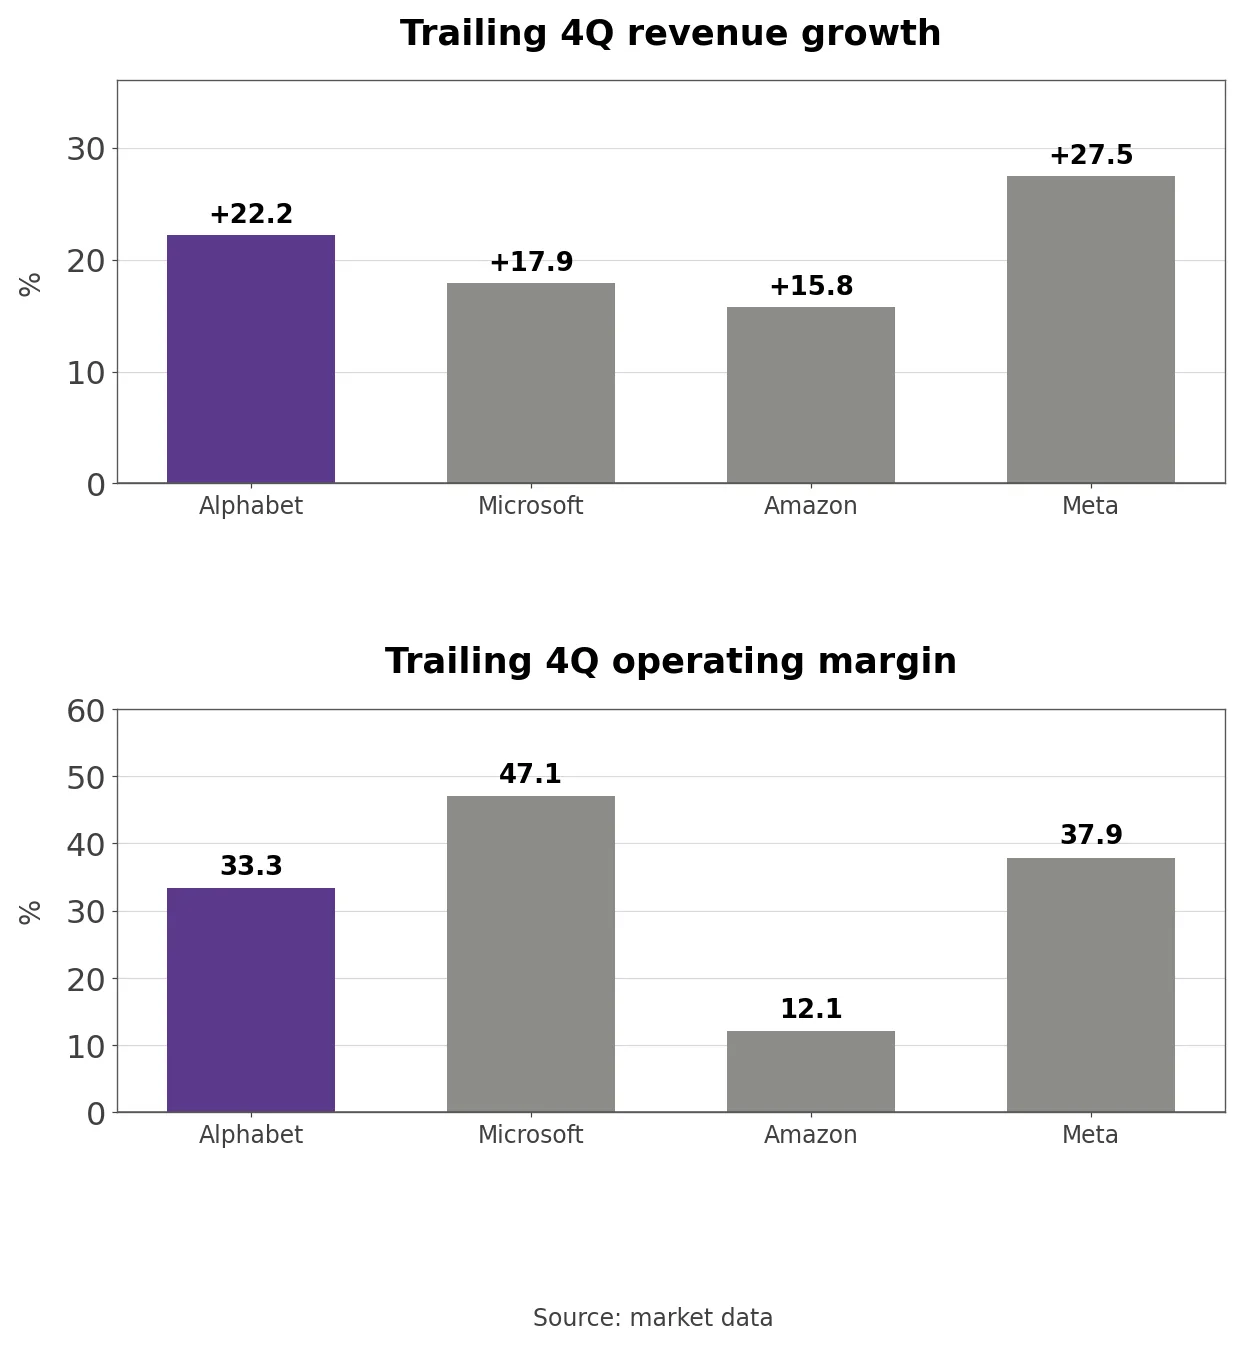
- Trailing four-quarter revenue growth was +27.5% at Meta, +22.2% at Alphabet, +17.9% at Microsoft and +15.8% at Amazon, with Amazon through June. Over the same trailing four quarters, operating margins were 47.1% at Microsoft, 37.9% at Meta, 33.3% at Alphabet and 12.1% at Amazon, which puts Alphabet second on growth and third on margin.
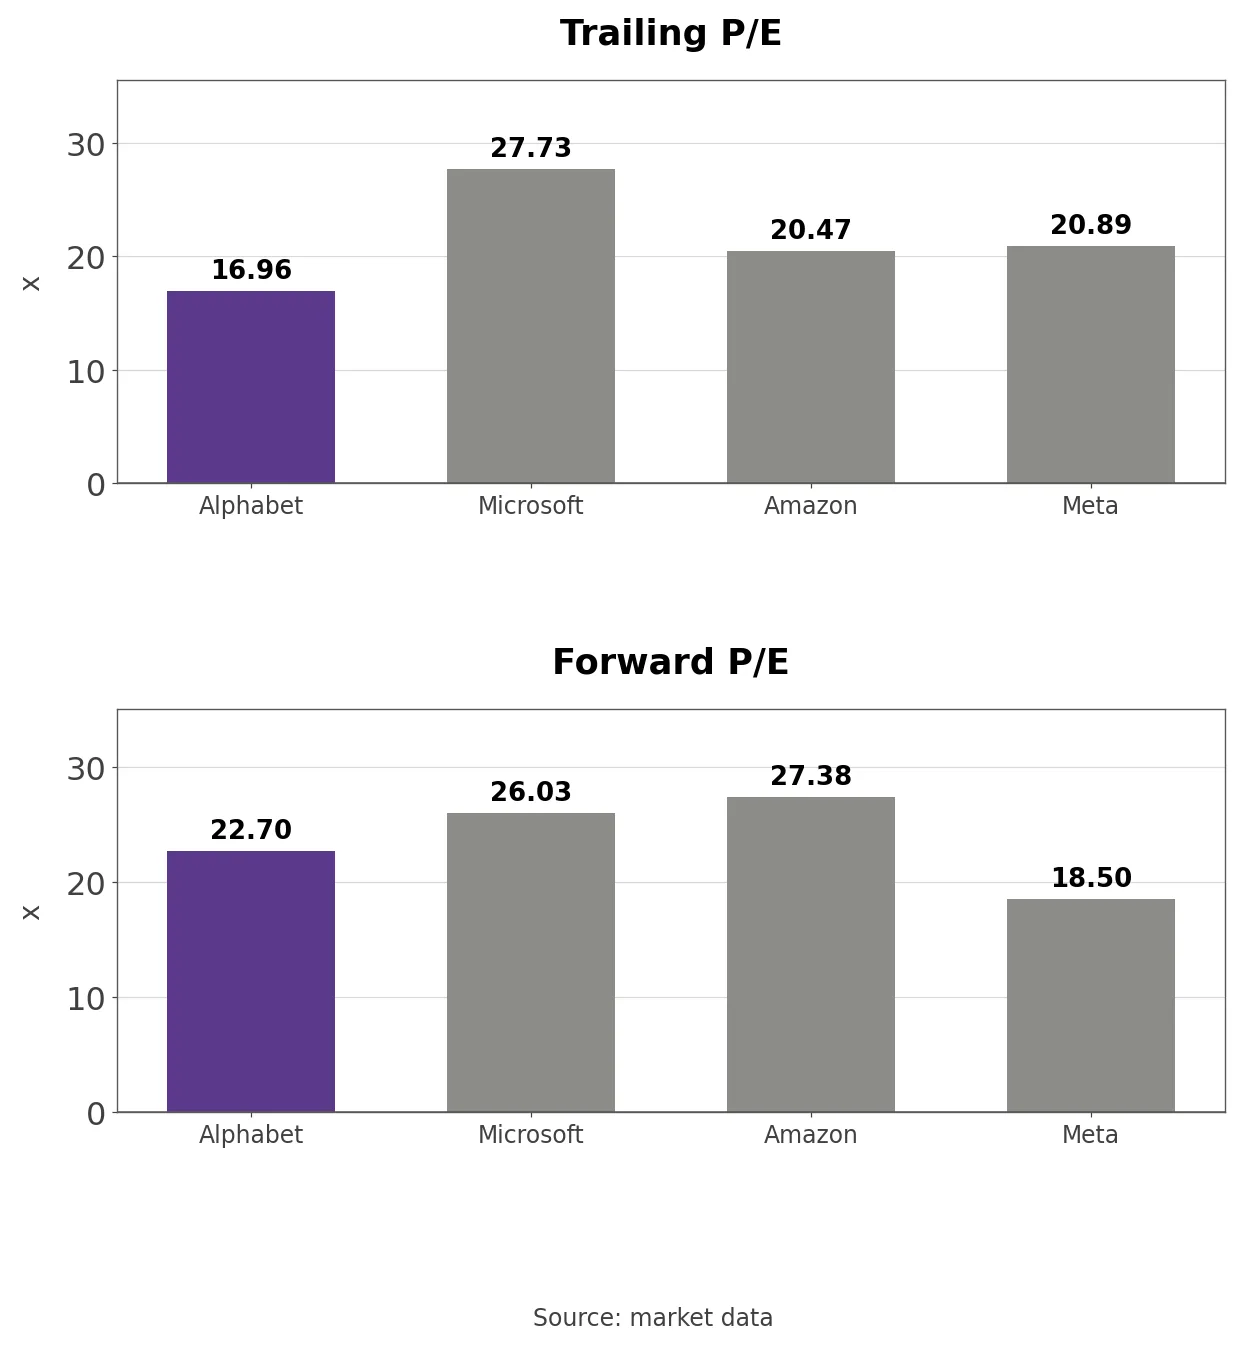
- On market data Alphabet has the lowest trailing P/E of the four at 16.96, but that figure includes equity gains. Excluding them it is 29.67, above Microsoft’s 27.73. Forward P/E is 27.38 for Amazon, 26.03 for Microsoft, 22.70 for Alphabet and 18.50 for Meta, and over the past year market values moved +26.4% at Alphabet, +14.8% at Amazon, -0.2% at Microsoft and -15.6% at Meta.
Alphabet P/E Without Equity Gains and Price-to-Sales Band
- On EPS excluding equity securities, the trailing P/E of 29.67 sits at the 81st percentile of the 59 months since December 2021, above the median of 24.88. The high was 39.07 in April 2026 and the low 18.69 in December 2022. The GAAP P/E of 16.96 is the lowest in 59 months only because equity gains made up 42.8% of trailing EPS.
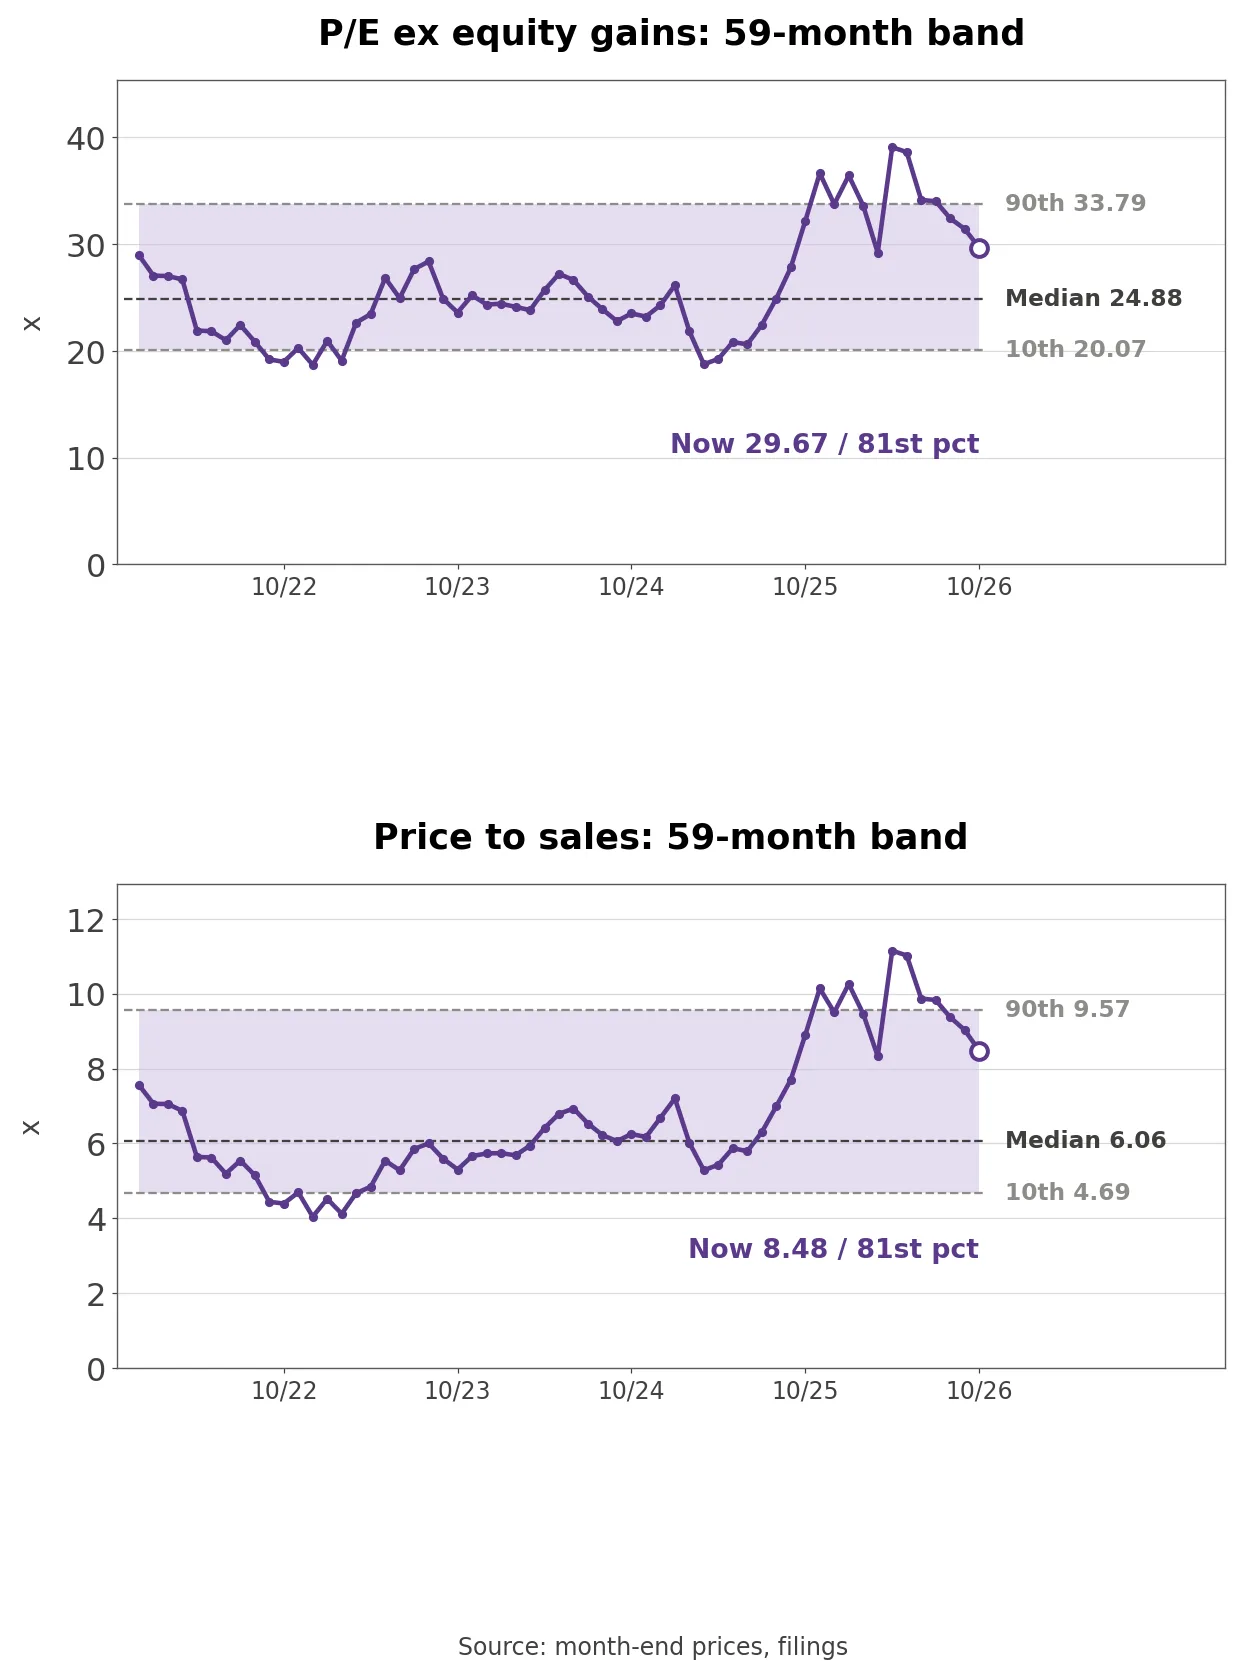
- The price-to-sales ratio of 8.48 is also at the 81st percentile, above a median of 6.06, with a high of 11.15 in April 2026 and a low of 4.04 in December 2022. Trailing EPS excluding equity securities rose +25.3% to $10.95 from $8.74. At the next-day opening price of $286.88, the P/E falls to 26.2 and price-to-sales to 7.49.
- Outside view (market data, after the Q3 report): One data source shows a P/E of 29.64 against a five-year median of 25.44 and price-to-sales of 8.53 against 6.25. Of 58 analysts, 42 rate the stock a strong buy, 12 a buy and 4 a hold, with an average price target of $428.70, and average revenue estimates are $500.29 billion for 2026 and $627.77 billion for 2027.
Three Conditions That Move the Stock
- Backlog conversion comes first. If just over 55% of the backlog is recognized within 24 months, that is about $156 billion a year, 1.7 times cloud’s trailing revenue. Cloud revenue that keeps rising from the $30 billion range while the backlog keeps growing gives the capex a visible payback; a stalled backlog with slowing cloud growth would mean spending ran ahead of demand.
- Capex as a share of operating cash flow was 121.4% in Q3. Fourth-quarter capex of $63 billion to $73 billion under guidance is higher than Q3’s $51 billion. If 2027 operating cash flow grows as fast as 2027 capex, free cash flow turns positive; if it stays negative, Alphabet leans further on the $27.6 billion of ATM capacity left and on more debt.
- Share count was 12.294 billion in September. Selling the remaining ATM capacity and converting the preferred stock would add to it for years and eat into the 25.3% growth in EPS excluding equity gains. Restarting buybacks under the $69.5 billion still authorized would reverse that trend.
What to Watch in the Next Earnings Report
- The next numbers come with fourth-quarter results in early February. The first figure to check is the 2027 capex guidance, followed by how fast the remaining $27.6 billion of ATM capacity is used, the change in the $567.7 billion backlog and the size of TPU system sales, most of which Alphabet expects to recognize in 2027.
- One question stays open. If operating cash flow cannot cover 2027 capex, will Alphabet’s next dollar of funding come from bonds or from shares?
Related Analysis
- Oracle (ORCL) Stock Analysis: Cash Flow and Capex Gap: another cloud provider whose capex outran operating cash flow, useful for comparing how each company funds the gap.
- Shopify (SHOP) Stock Analysis: Net Income vs. Equity Gains: a second case where gains on investments inflated net income, showing why a footnote-adjusted P/E matters.