Microsoft (MSFT) Stock: OpenAI Is 10.8% of Revenue
Contents
- Microsoft (NASDAQ: MSFT) reported revenue of $92.28 billion for the first quarter of fiscal 2027, the three months to September 30, 2026, +18.8% from a year earlier. Its 10-Q shows that $10.0 billion of that, 10.8% of the total, came from a single customer: OpenAI, in which Microsoft holds an equity-method stake of about 24%. Revenue from OpenAI was $24.1 billion for all of fiscal 2026, or 7.3% of sales, and receivables owed by OpenAI rose from $6.0 billion to $7.2 billion in one quarter.
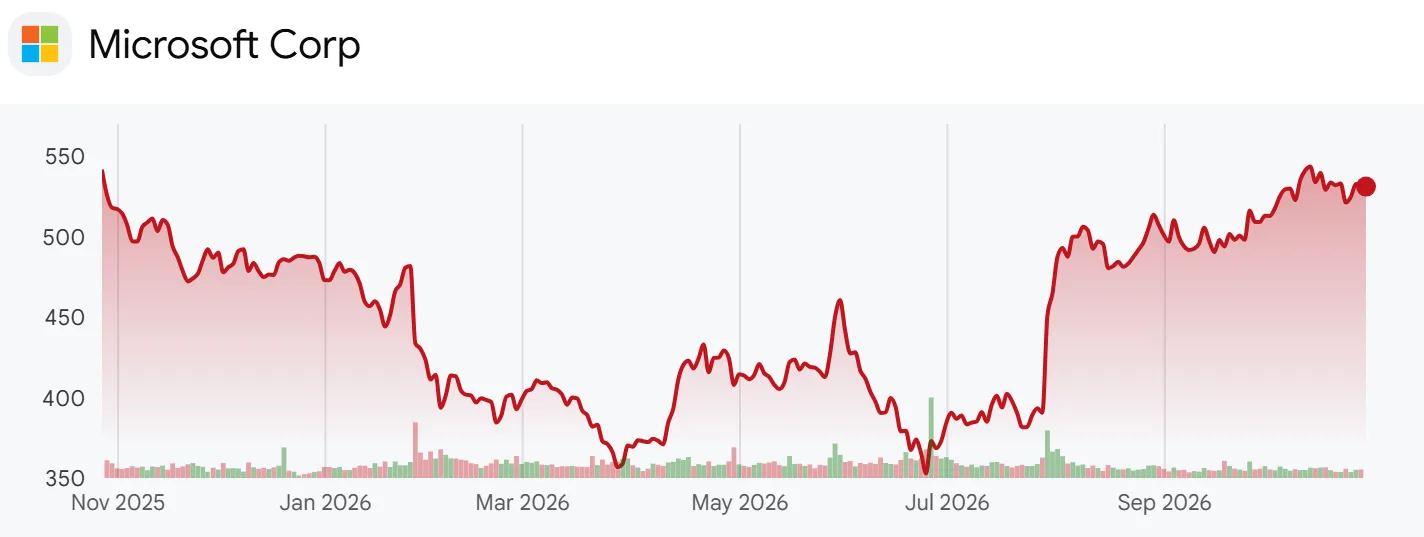
- Microsoft sells Azure cloud capacity, Microsoft 365 subscriptions, Windows licenses, Xbox content and LinkedIn and search advertising. At $531.01 a share it is worth $3.94 trillion. The stock fell -30.1% from a month-end close of $533.50 in July 2025 to $373.02 in June 2026, then rose +42.4% back to where it started.
- The question here is how much of this quarter’s growth came from OpenAI, and how much weight that one customer now carries in Microsoft’s revenue, backlog and capital spending. The analysis lines up the Q1 earnings release, the Q1 10-Q and the fiscal 2026 10-K with the 22-page segment deck filed in September and 32 quarterly releases going back to the December 2018 quarter.
- Two caveats apply. Capital expenditures here are cash additions to property and equipment from the cash flow statement, which exclude the finance leases Microsoft adds in its own capex figure. The Q1 call transcript was not available, so management commentary comes from the July call and the September deck.
What the September Deck Changed in Segments and Azure
- The deck Microsoft filed on September 2 replaced its three segments, Productivity and Business Processes, Intelligent Cloud and More Personal Computing, with two: Agents and Infra, and Devices and Consumer. Satya Nadella’s letter in the deck opens with “There’s no question AI represents a profound shift in both technology and business.” and says the reporting now mirrors how the business is run, with “full transparency of quarterly revenue across each of our key businesses” including Azure, Microsoft 365 cloud, Industry solutions and ads.
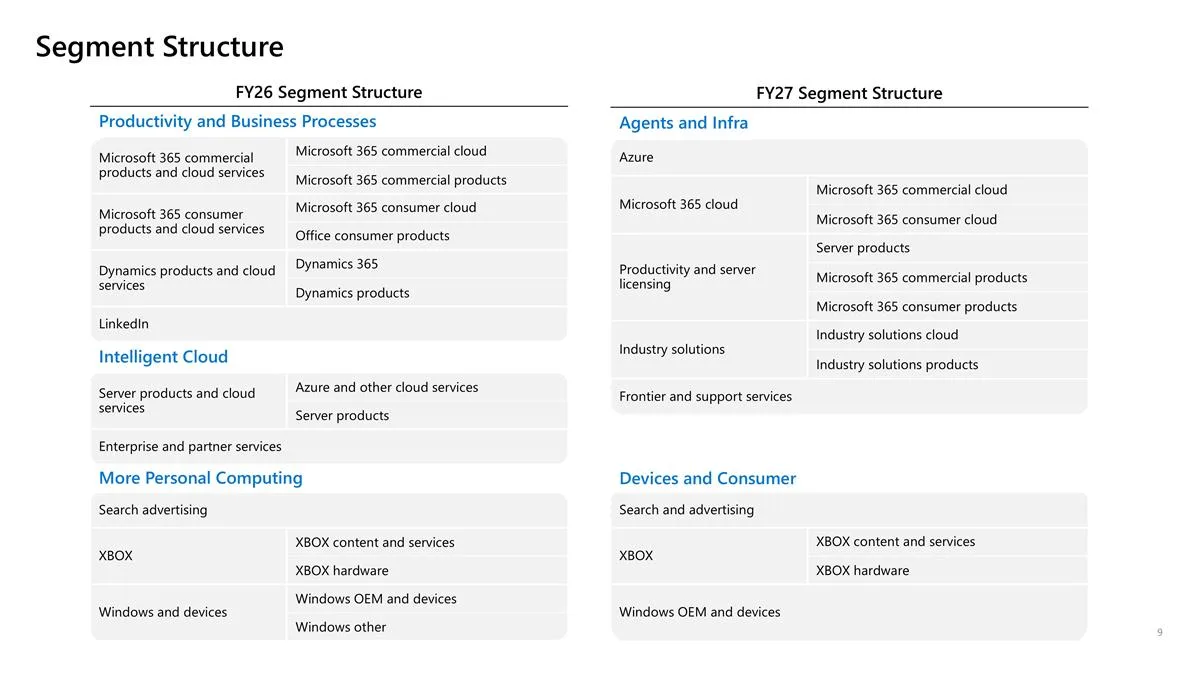
- Slide 9 maps the old structure to the new one. GitHub cloud and Security Copilot moved out of Azure into Microsoft 365 cloud, and Healthcare and Life Sciences cloud moved into a new Industry solutions line. The letter puts it this way: “Under this reporting structure, Azure becomes more purely our consumption-based platform and infrastructure business.” In exchange, Microsoft now reports Azure revenue in dollars, and the Q1 10-Q shows $33.17 billion. Slide 13 defines the new Azure as revenue from cloud and AI consumption-based services and virtual desktop offerings.
- Slides 11 and 13 change several metric definitions. Microsoft 365 commercial seats now include paid GitHub seats, search and advertising now includes LinkedIn Marketing Solutions and Premium subscriptions, and Industry solutions cloud combines Dynamics 365, LinkedIn Talent and Sales Solutions and Healthcare cloud. LinkedIn no longer appears as a line of its own.
- Slide 15 restates fiscal 2026 under the new segments. Agents and Infra produced revenue of $268.13 billion and operating income of $136.37 billion, a 50.9% margin, while Devices and Consumer produced $63.71 billion and $18.87 billion, a 29.6% margin. About 88% of operating income now sits in Agents and Infra.
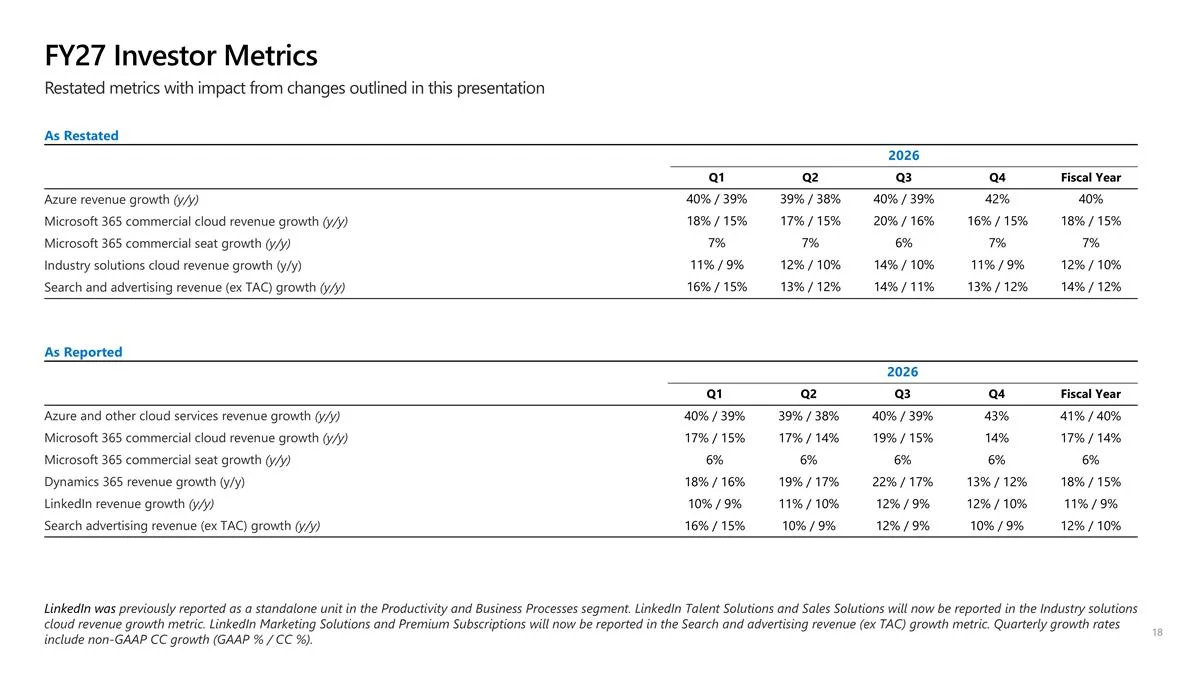
- Slide 18 restates the investor metrics. Under the new definition Azure grew 40%, 39%, 40% and 42% through the four quarters of fiscal 2026, almost the same as before, and then 48% in Q1 of fiscal 2027. Microsoft 365 commercial cloud was restated to 18%, 17%, 20% and 16% over the same four quarters, so the acceleration after the change shows up in Azure while the subscription line stayed in the high teens.
- Company disclosure (Q1 earnings release): CFO Amy Hood said Microsoft Cloud revenue was $63.9 billion with growth accelerating to 30%, and added: “Results exceeded expectations across revenue, operating income, and earnings per share.” The release listed Microsoft 365 commercial cloud revenue up 17%, or 18% adjusted for a one-point benefit in the prior year, Microsoft 365 consumer cloud up 17% and Industry solutions cloud up 10%. Its headline was “Microsoft Announces First Quarter Results.” The seven releases from January 2025 to July 2026 all began with “Microsoft Cloud and AI Strength.”
How Q1 Compared With the July Outlook
- Slide 20 restates the outlook Microsoft gave on July 29 in the new segment structure: revenue of $89.85 billion to $90.95 billion, Agents and Infra of $75.15 billion to $75.75 billion, Devices and Consumer of $14.7 billion to $15.2 billion, a roughly flat operating margin, a tax rate of about 20%, and capital expenditures “Expected to be over $50 billion including the impact of the useful life update.”
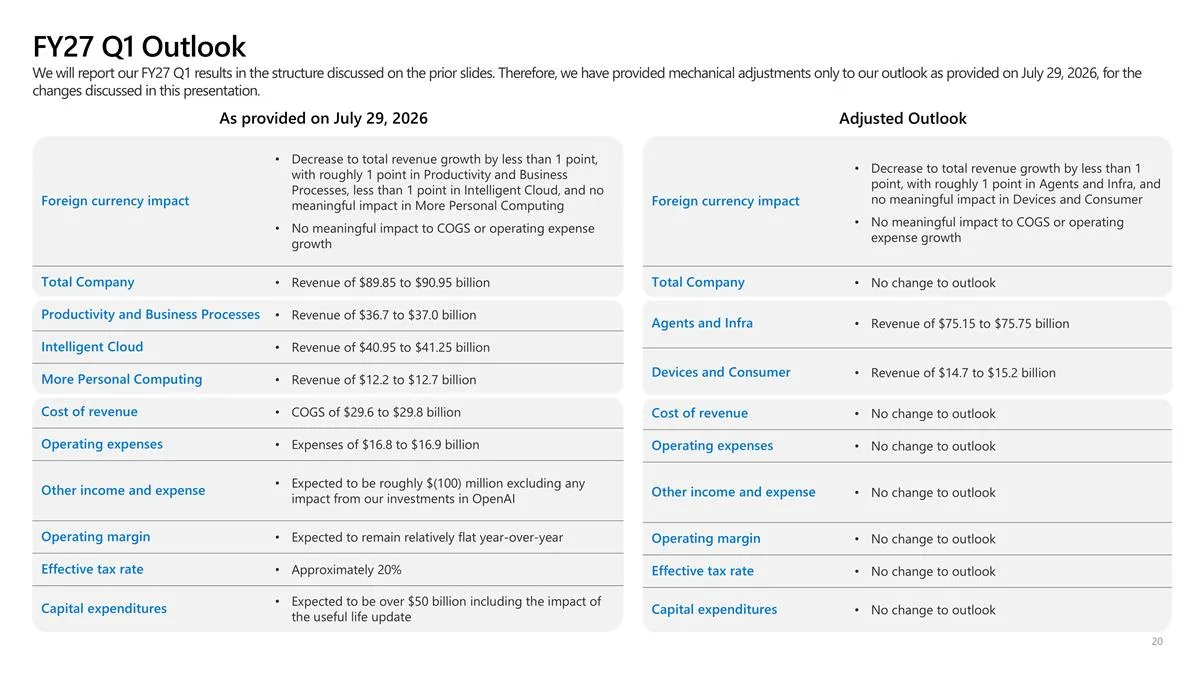
- Own calculation (slide 20, Q1 release and 10-Q): Revenue of $92.28 billion beat the top of the range by $1.33 billion, and both Agents and Infra at $76.8 billion and Devices and Consumer at $15.5 billion came in above their ranges. Cost of revenue of $29.72 billion was inside the range and operating expenses of $16.64 billion came in below it, so operating margin was 49.8% against 48.9% a year earlier rather than flat. Other income excluding OpenAI was -$234 million against guidance of about -$100 million, and the tax rate was 20%.
- The useful life change came from the July call. Hood said that from fiscal 2027 Microsoft extends the useful life of datacenter and office buildings from 15 to 25 years. The operating income effect is small, she said, but more future datacenter leases will be classified as operating leases rather than finance leases, which lowers the company’s capex figure because finance leases count as capex and operating leases do not.
- The July call also separated OpenAI from the backlog. Hood said commercial remaining performance obligation (RPO) rose 84% to $678 billion, but 25% excluding OpenAI, and that all of the sequential growth came from customers outside frontier model companies. Commercial bookings rose 18% excluding OpenAI and 10% including its Azure commitment.
The Bull and Bear Case for Microsoft Shares
- The bull case rests on breadth. Revenue and Agents and Infra beat the top of guidance, Azure accelerated to 48%, and margin held near 50% while capex doubled. Backlog excluding OpenAI grew 25% as of July, and the trailing P/E of 27.71 is below its 59-month median of 32.73.
- The bear case rests on concentration. OpenAI went from 7.3% to 10.8% of revenue, and the same company is a 24% equity-method investee that owes Microsoft $7.2 billion. Capex now takes 67.9% of operating cash flow, free cash flow fell -27.4%, and RPO has not grown from the prior quarter.
From a 2019 Partnership to a Related Party
- The 10-K traces the relationship to a long-term strategic partnership established in 2019 and states that “Microsoft is a major investor in OpenAI and will continue to receive revenue-sharing payments.” Microsoft also holds intellectual property rights to OpenAI’s models and infrastructure. In October 2025 OpenAI formed a public benefit corporation and completed a recapitalization, and Microsoft now accounts for its stake under the equity method; the 10-K put it at about 25% on an as-converted basis at June 30, 2026.
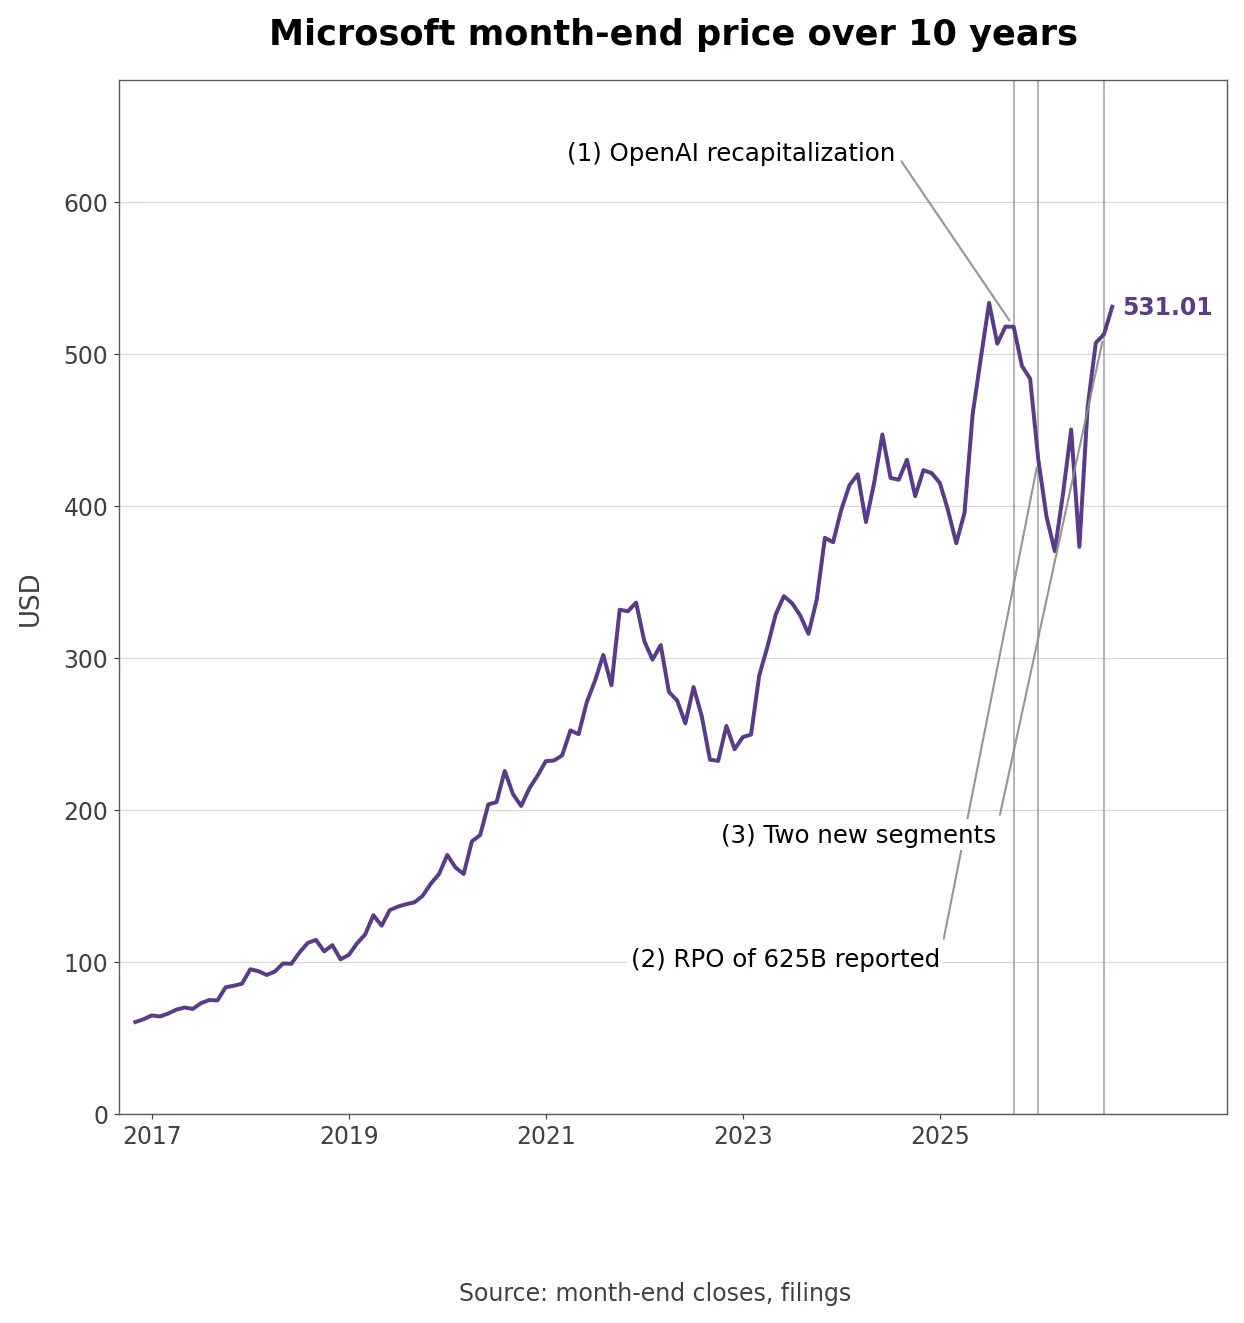
- The numbers changed shape after that. Commercial RPO reached $625 billion in the December 2025 quarter, +110% from a year earlier, and GAAP diluted EPS of $5.16 in that quarter included dilution gains from the recapitalization. The stock then fell to a month-end close of $373.02 in June 2026, a trailing P/E of 20.77 and the lowest in 59 months. Microsoft extended the partnership again in April 2026 and moved to two segments in September.
- OpenAI gains and losses have swung reported earnings both ways. A year ago the OpenAI investment cost $4.06 billion in other income and $3.09 billion in net income; this quarter it added $272 million to other income and $207 million to net income. That is why GAAP net income rose +32.0% while net income excluding OpenAI rose +18.1%.
How Much of Microsoft’s Growth Came From OpenAI?
- Filing note (Q1 10-Q): The 10-Q explains that “As an equity method investee, OpenAI is a related party” and discloses revenue from commercial arrangements with OpenAI, including revenue-sharing payments, of $10.0 billion for the quarter. Receivables from OpenAI were $7.2 billion at September 30 against $6.0 billion at June 30. The stake fell from about 25% to about 24%, and Microsoft has funded $12.0 billion of a $13.0 billion commitment.
- Own calculation (10-Q, 10-K and restated results): OpenAI revenue of $24.1 billion was 7.3% of fiscal 2026 revenue of $331.84 billion, and this quarter’s $10.0 billion is 10.8% of $92.28 billion. It is $3.98 billion above the fiscal 2026 quarterly average of $6.03 billion, equal to 27.2% of the quarter’s $14.61 billion revenue increase. Set against Azure revenue of $33.17 billion, it is 30.2% of Azure’s size.
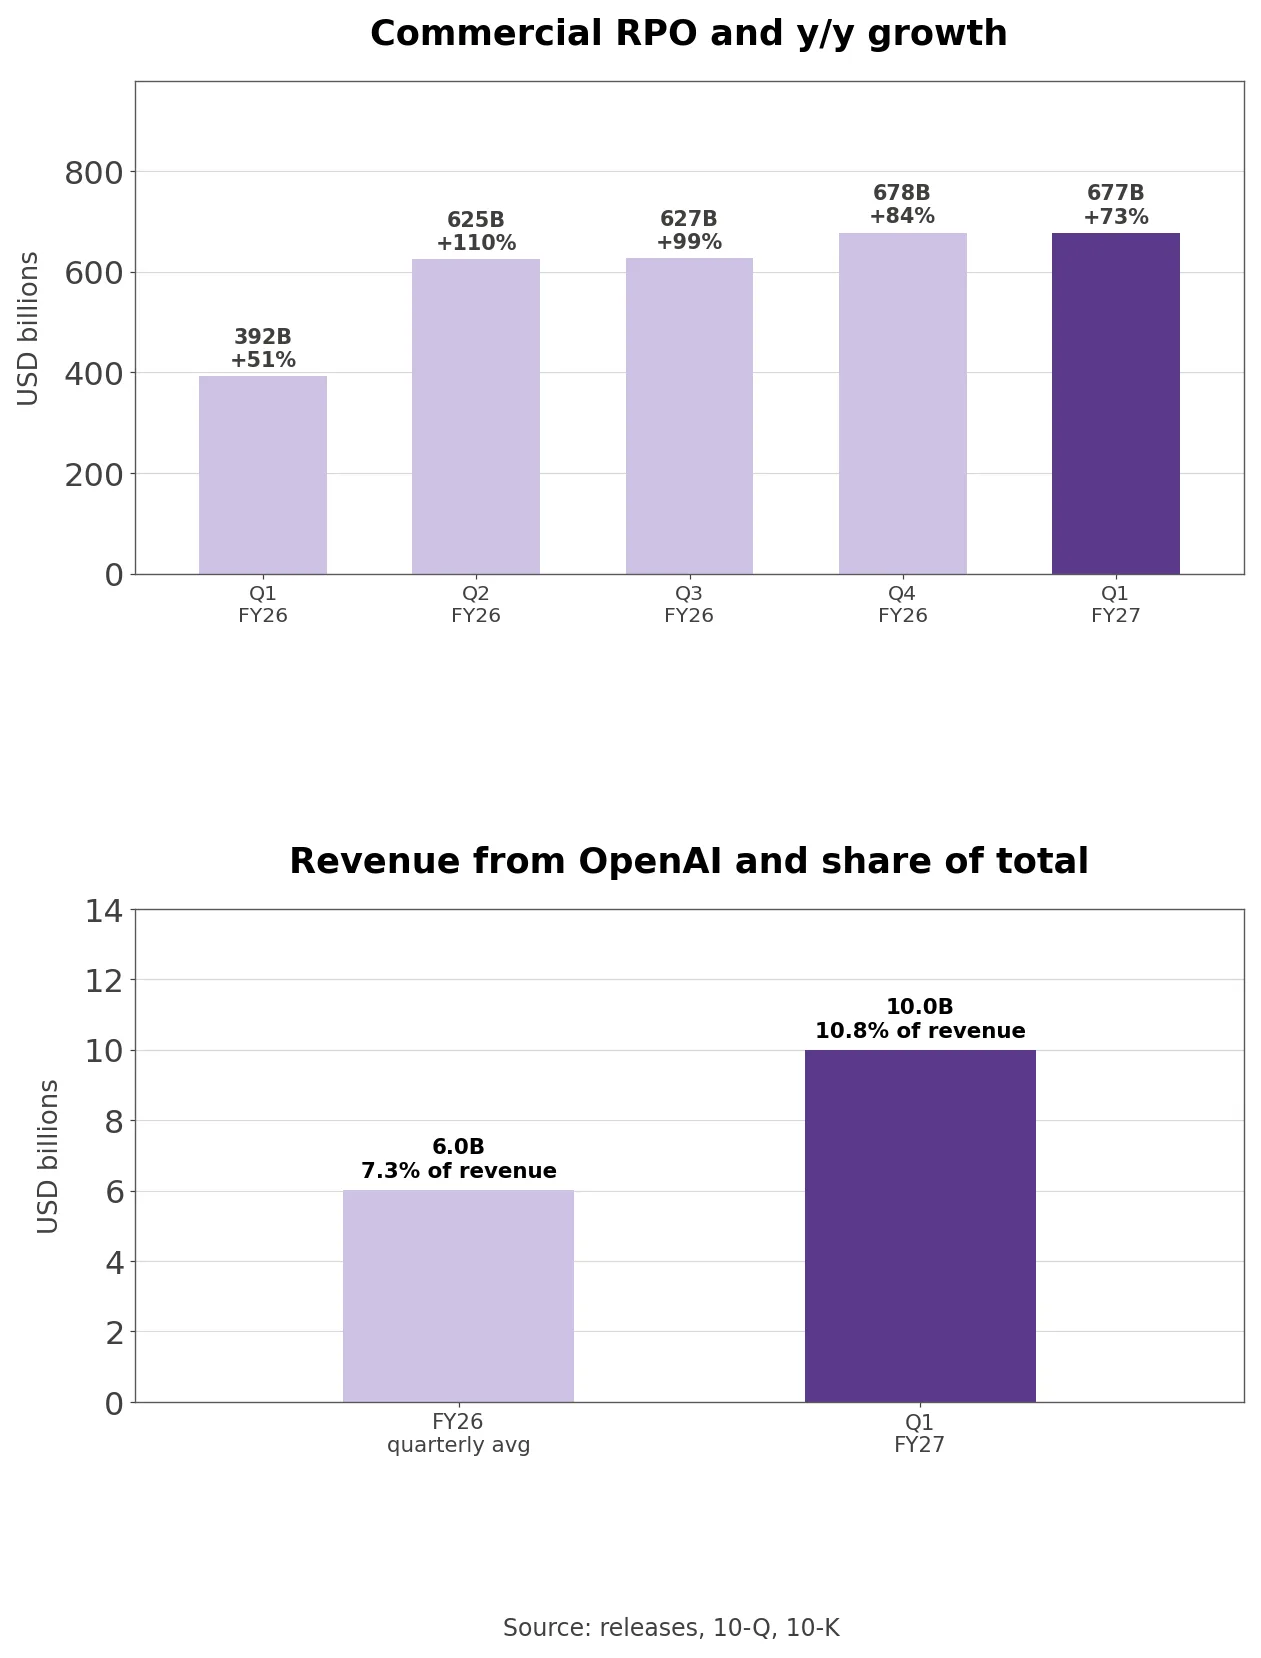
- Backlog growth and backlog level tell different stories. Commercial RPO rose +73% to $677 billion, but after jumping to $625 billion in the December 2025 quarter it has moved to $627 billion, $678 billion and $677 billion. The 10-Q says about 30% will be recognized within 12 months, with a weighted average duration of about 2.3 years, which puts roughly $203 billion of it into revenue over the next year.
- Azure carried most of the growth. Azure revenue rose from $22.38 billion to $33.17 billion, +48.2%, and that $10.78 billion increase was 73.8% of the company’s total revenue increase. Microsoft does not split OpenAI revenue by product, so the share that is Azure consumption rather than revenue sharing cannot be read from the filings. Receivables of $7.2 billion are equal to 72% of the quarter’s OpenAI revenue.
Capex Doubled and Free Cash Flow Fell
- Cash additions to property and equipment were $39.37 billion, up from $19.39 billion, +103.0%. Operating cash flow rose +28.7% to $58.0 billion, but capex rose faster, so free cash flow fell from $25.66 billion to $18.63 billion, -27.4%.
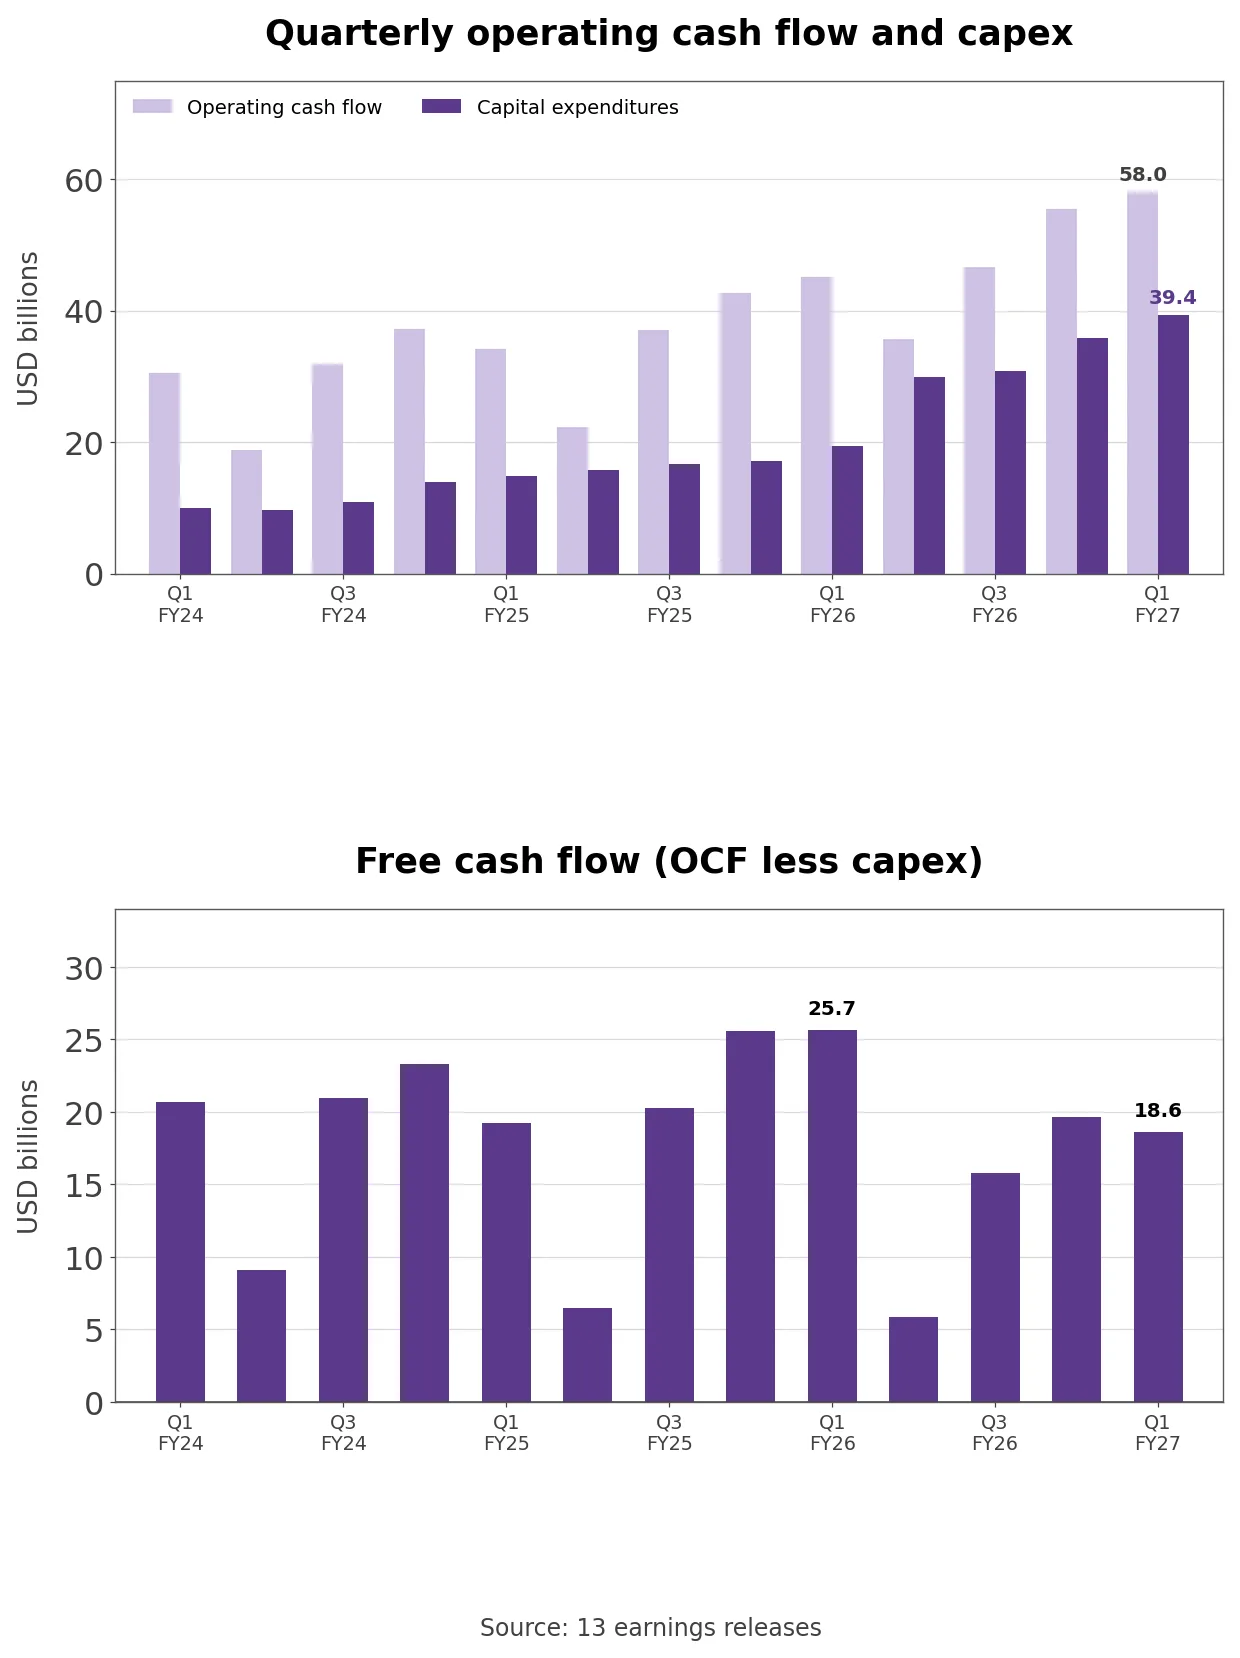
- Own calculation (13 releases, Q1 FY24 to Q1 FY27): Capex rose from 43.0% to 67.9% of operating cash flow in a year. Quarterly capex went from $9.92 billion in Q1 of fiscal 2024 to $29.88 billion in Q2 of fiscal 2026 and $39.37 billion now, roughly four times in 13 quarters.
- Shareholder returns held up. Buybacks fell from $5.65 billion to $4.38 billion, dividends rose from $6.17 billion to $6.76 billion, and the release put Q1 returns at $10.2 billion. The useful life change also shifts how the cash shows up: an operating lease lowers the company’s capex figure, but its full payment runs through operating cash flow, which a finance lease does not, so the same datacenter changes both numbers.
How Microsoft Makes Money After the Segment Change
- Under the new product lines, Q1 revenue was $33.17 billion from Azure (35.9%), $27.78 billion from Microsoft 365 cloud (30.1%), $8.41 billion from productivity and server licensing (9.1%) and $6.55 billion from search and advertising (7.1%). Xbox brought $5.38 billion and Industry solutions $5.34 billion, 5.8% each, Windows OEM and devices $3.55 billion (3.8%), and Frontier and support services, the renamed Enterprise and Partner services, $2.11 billion (2.3%).
- Growth split between cloud and devices. Azure grew +48.2%, Microsoft 365 cloud +17.2%, search and advertising +10.3% and Industry solutions +9.1%, while Windows OEM and devices fell -22.0%, productivity and server licensing -3.1% and Xbox -2.3%. Agents and Infra grew 25% to $76.8 billion and Devices and Consumer fell 3% to $15.5 billion, so 83% of revenue now comes from Agents and Infra.
- The two segments earn money differently. Agents and Infra bundles cloud subscriptions and consumption, licensing and consulting for business customers. Devices and Consumer bundles Windows licenses sold through PC makers, Surface devices, Xbox content and hardware, and Bing and LinkedIn advertising. Because Azure is now purely consumption-based, its revenue follows usage and the capacity built to serve it. Microsoft 365 is billed per seat, and under the deck’s definitions Microsoft 365 commercial cloud now includes Microsoft 365 Copilot, GitHub cloud and Security Copilot.
- The 10-Q says “Microsoft Cloud gross margin percentage decreased to 66% driven by sales mix shift to Azure”, as Microsoft Cloud revenue of $63.9 billion grew 30%. On the July call Nadella said Microsoft offers more than 11,000 models in its cloud, including OpenAI, Anthropic, Mistral and xAI models alongside its own MAI family, and that its Maia 200 chip delivers 30% better performance per dollar than existing hardware. Sourcing models from several labs is one way to dilute the dependence on OpenAI.
- The consumer promises have not yet shown up in the numbers. In July Nadella said Xbox is being reset for long-term growth with a goal of returning it to growth in fiscal 2027, and that Windows should be the best place to run secure edge AI. In the first quarter Xbox fell 2.3% and Windows OEM and devices fell 22.0%. Hood said on the same call that headcount was down 2% from a year earlier.
How Microsoft Compares With Three Cloud Peers
- The peers are three U.S.-listed cloud companies whose earnings ride on the same AI datacenter demand and capex cycle. Alphabet sells search advertising and Google Cloud, Amazon sells retail and AWS, and Oracle sells databases and Oracle Cloud Infrastructure. Market values are $3.97 trillion for Alphabet, $3.94 trillion for Microsoft, $2.75 trillion for Amazon and $438.17 billion for Oracle.
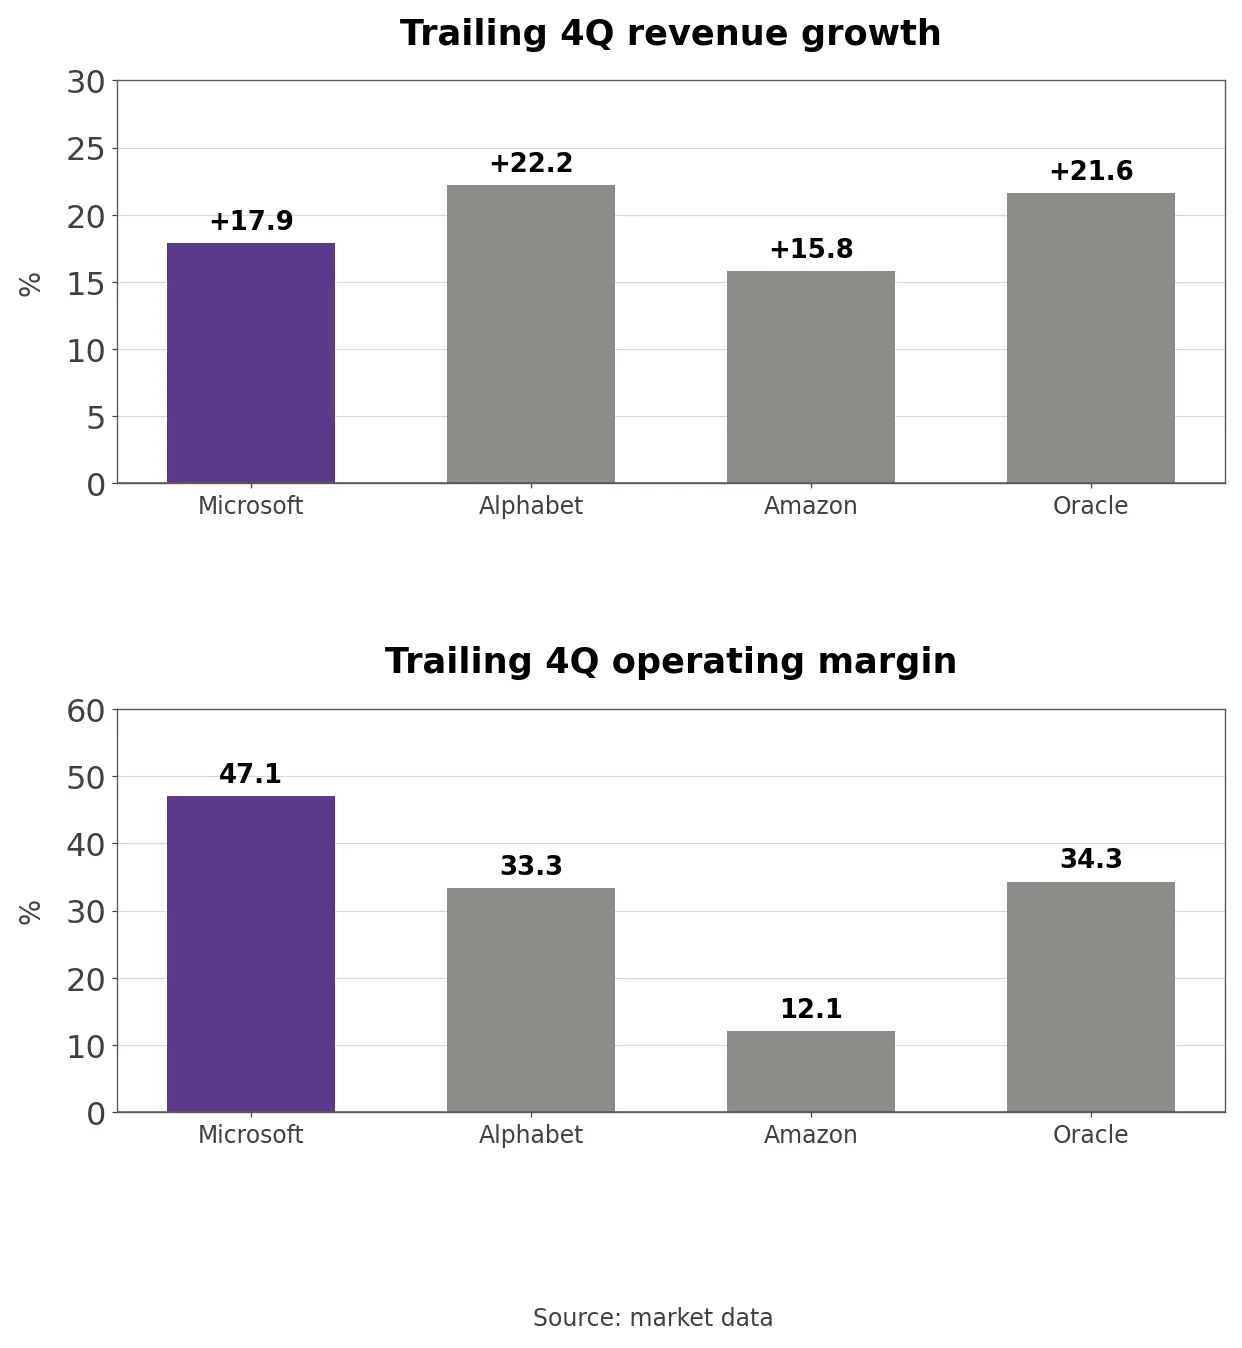
- Trailing four-quarter revenue growth was +22.2% at Alphabet, +21.6% at Oracle, +17.9% at Microsoft and +15.8% at Amazon, with Amazon through June and Oracle through August 2026. Over the same trailing four quarters, operating margins were 47.1% at Microsoft, 34.3% at Oracle, 33.3% at Alphabet and 12.1% at Amazon.
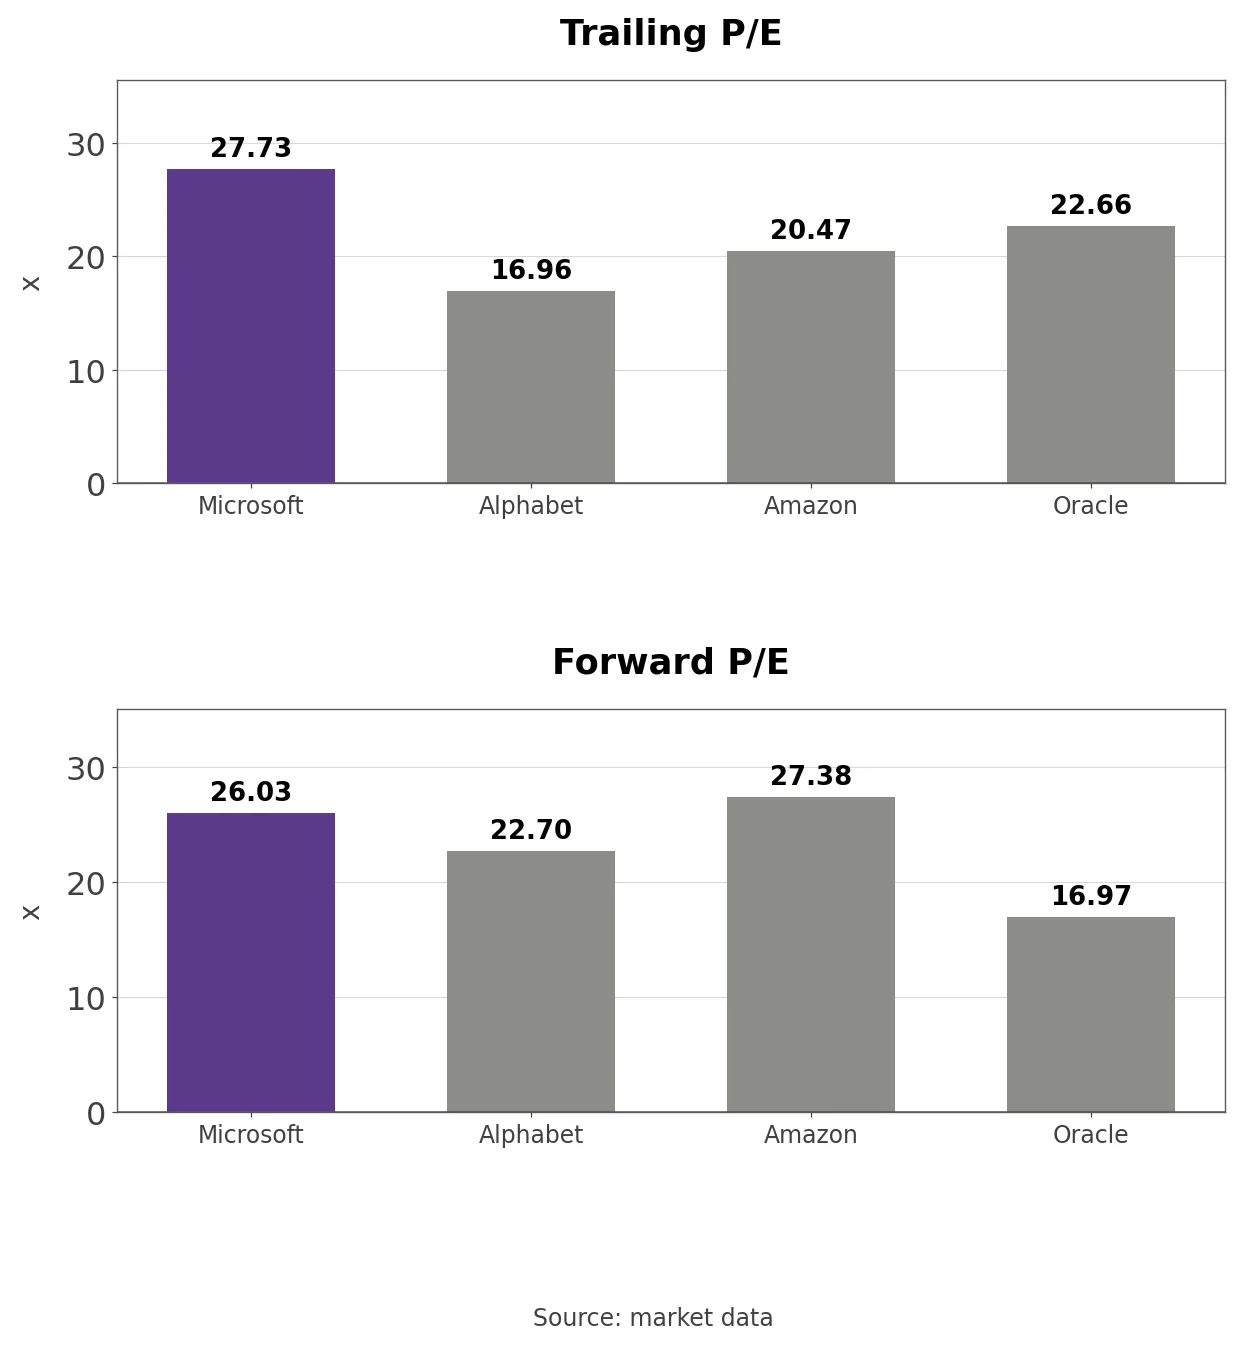
- Trailing P/E was 27.73 for Microsoft, 22.66 for Oracle, 20.47 for Amazon and 16.96 for Alphabet, while forward P/E was 27.38 for Amazon, 26.03 for Microsoft, 22.70 for Alphabet and 16.97 for Oracle. Microsoft is the most expensive of the four on trailing earnings but cheaper than Amazon on forward earnings. Over the past year market values moved +26.4% at Alphabet, +14.8% at Amazon, -0.2% at Microsoft and -45.6% at Oracle, opposite results from the same AI datacenter demand.
Microsoft’s P/E and Price-to-Sales Band
- On GAAP diluted EPS the trailing P/E of 27.71 sits at the 29th percentile of the 59 months since December 2021, below the median of 32.73. The high was 39.11 in July 2025 and the low 20.77 in June 2026. Since June the stock rose 42.4% while trailing EPS rose from $17.96 to $19.16, or +6.7%, so most of the rebound came from the multiple expanding 33.4%.
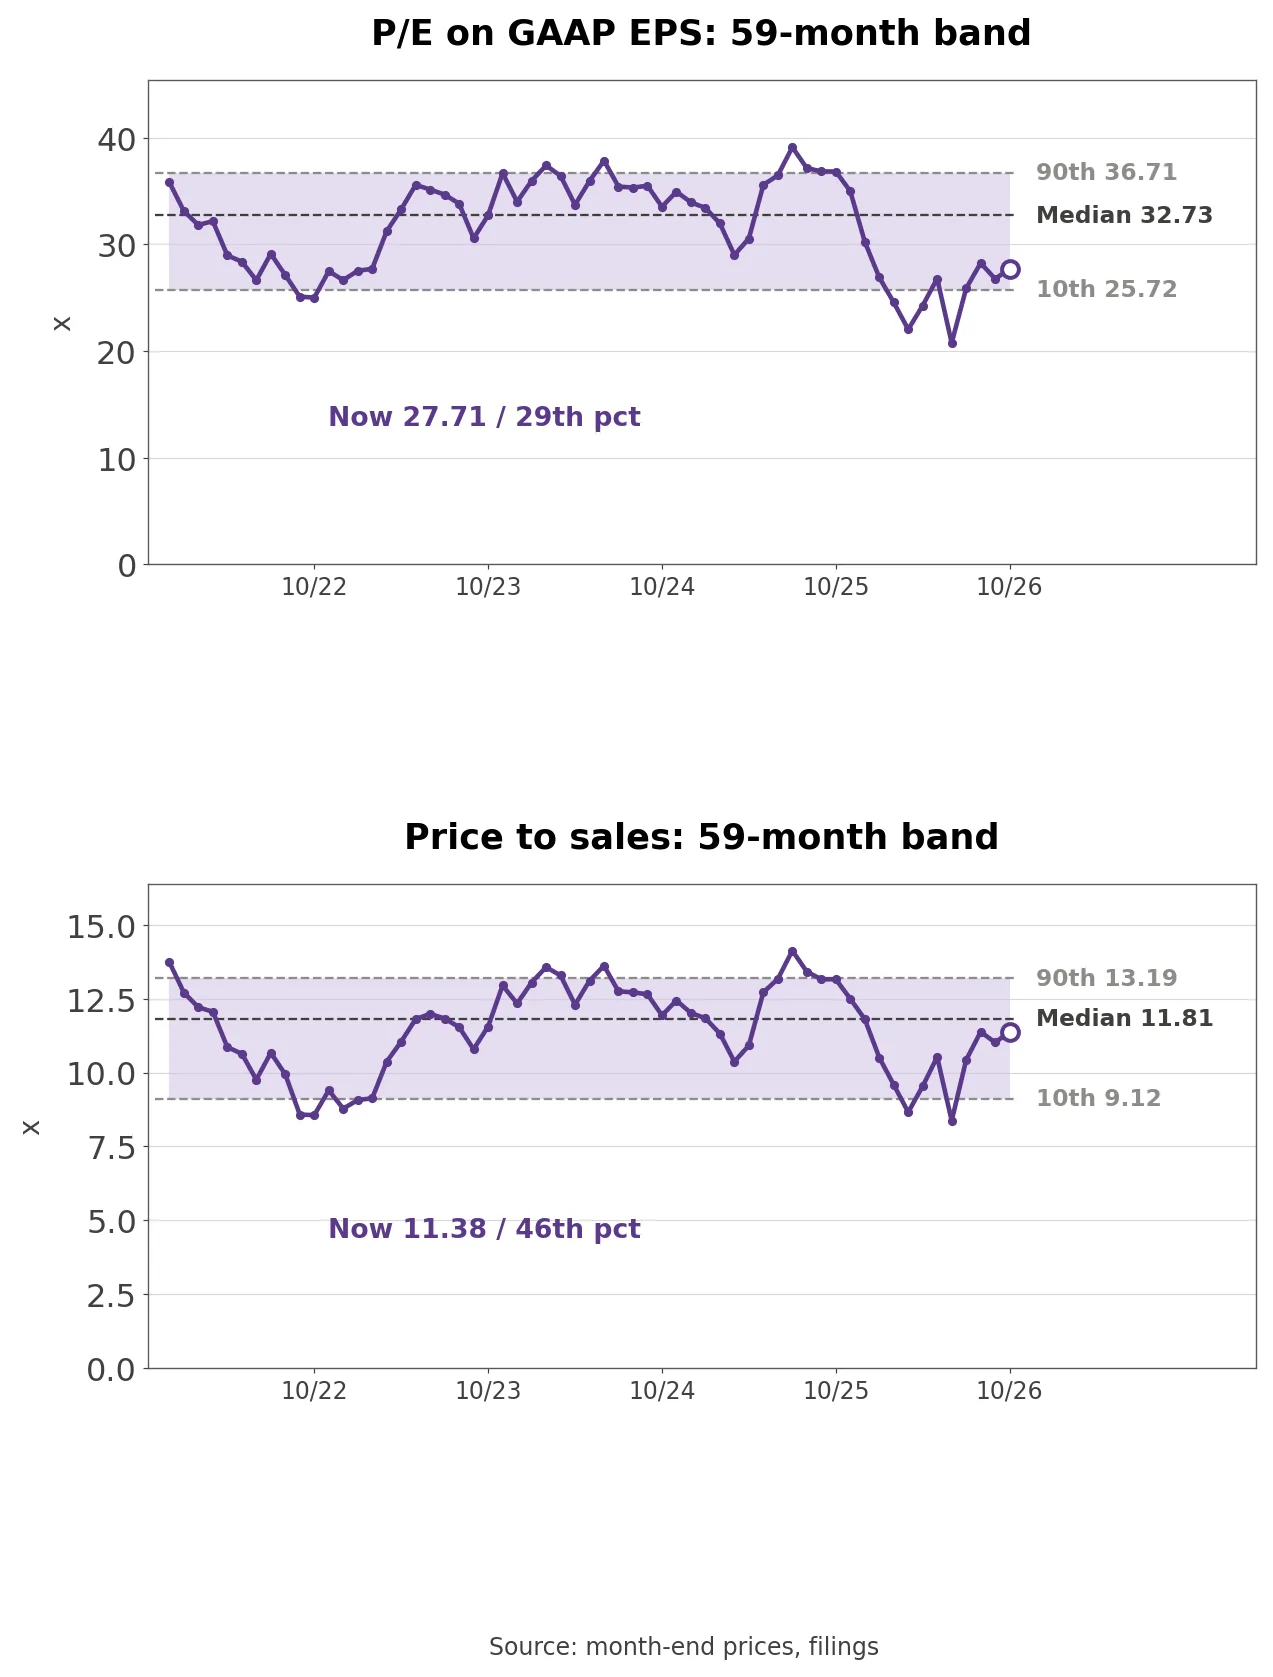
- The price-to-sales ratio of 11.38 is at the 46th percentile, near the median of 11.81, with a low of 8.37 in June 2026. Because margins held steady, the two multiples moved together and both bottomed in June 2026; neither sits in the upper half of its 59-month range.
- Outside view (consensus estimates, market data): Average EPS estimates are $19.76 for fiscal 2027 and $23.69 for fiscal 2028, putting the stock at 26.9 times and 22.4 times. A second data source shows a P/E of 29.44 against a five-year median of 33.48, and a price-to-sales ratio of 11.41 that it also places below its five-year norm.
Three Conditions That Move the Stock
- OpenAI revenue and receivables will appear again in the next related-party disclosure. If OpenAI revenue keeps growing while receivables grow more slowly, the largest customer is paying on time for its growth; if receivables pile up faster than quarterly revenue or the stake is diluted further, the same 10.8% turns into concentration risk.
- Capex as a share of operating cash flow was 67.9% in Q1. If operating cash flow grows faster than capex and that share falls, free cash flow recovers; above 70%, free cash flow of $18.63 billion shrinks toward the $10.2 billion Microsoft returned in Q1 through dividends and buybacks.
- Azure growth was 48% under the new definition. Holding near 50% would show the $677 billion backlog turning into revenue at pace; a slowdown to the low 40s would combine with a flat RPO to lower growth expectations.
What to Watch in the Second-Quarter Report
- The next numbers arrive with second-quarter results in late January. The first checkpoints are how OpenAI revenue, receivables and the stake change in the related-party note, whether commercial RPO grows again from $677 billion, and the capex figure including finance leases with any fiscal 2027 outlook.
- One question stays open. The filings do not split the $10.0 billion between Azure consumption and revenue sharing, so if OpenAI ever cuts its spending, how many points of Azure’s 48% growth would go with it?
Related Analysis
- NVIDIA (NVDA) Stock Analysis: Guarantees and Cash Flow: another supplier tied to OpenAI through receivables and guarantees, useful for comparing how the same customer weighs on both sides of the AI supply chain.
- Oracle (ORCL) Stock Analysis: Cash Flow and Capex Gap: a cloud peer whose capex has outrun operating cash flow, a reference point for Microsoft’s 67.9% capex-to-cash-flow ratio.