Western Digital (WDC) Stock: Pricing Outran Exabytes
Contents
- Western Digital (NASDAQ: WDC) grew fiscal first-quarter 2027 revenue +55% to $4.38 billion, but 61.1% of the increase came from a higher price per terabyte rather than from shipping more hard drives. Management reported exabyte shipments up 22% and blended average selling price per terabyte up 28%. In February the company set a three-to-five-year model that assumes mid-20s nearline exabyte growth and “Stable pricing” to reach EPS above $20, yet the December-quarter EPS guide of $5.80 already annualizes to $23.20. What remains open is whether the earnings that pricing built will survive a year in which prices flatten, as the company’s own model assumes.
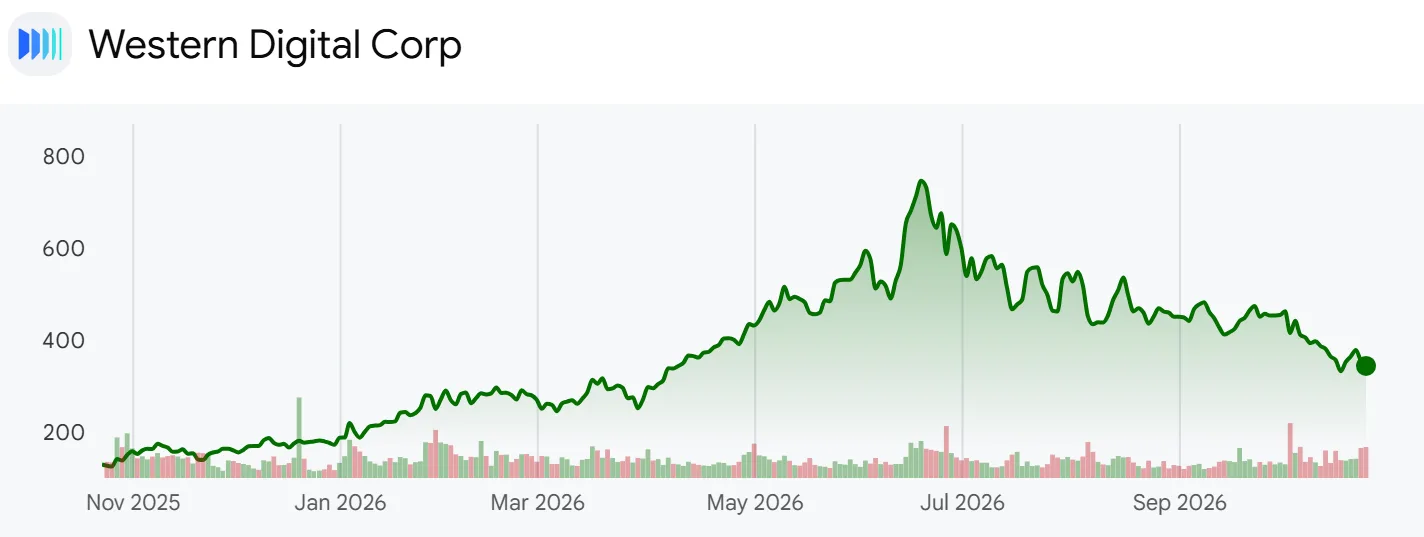
- Since spinning off its flash business as Sandisk in February 2025, WD has been a pure hard disk drive company, and 88.3% of first-quarter revenue came from cloud customers. At $343.67 a share it is worth $128.6 billion. The stock is +99.5% in 2026 but -46.2% from its June month-end close of $638.72; it fell -20.1% in the two weeks before results and rose +3.5% in results week. The analysis lines up seven post-spin quarterly releases with the exabyte bars in each quarterly deck and checks them against the first-quarter earnings release, the 10-Q, the fiscal 2026 10-K, the February 2026 Innovation Day deck, the August investor presentation and the call remarks. WD’s fiscal year ends around late June, so July to September is its first quarter; this piece uses the company’s quarter names. Quarterly comparisons and the valuation band use post-spin HDD figures only. Revenue per terabyte is revenue divided by exabytes shipped, a calculation that differs slightly from the company’s blended ASP. The P/E uses trailing twelve-month (TTM) non-GAAP diluted EPS of $13.05; on TTM GAAP EPS of $25.77, which includes gains on the Sandisk stake, it is 13.34.
What the Quarterly Deck Shows About Price and Volume
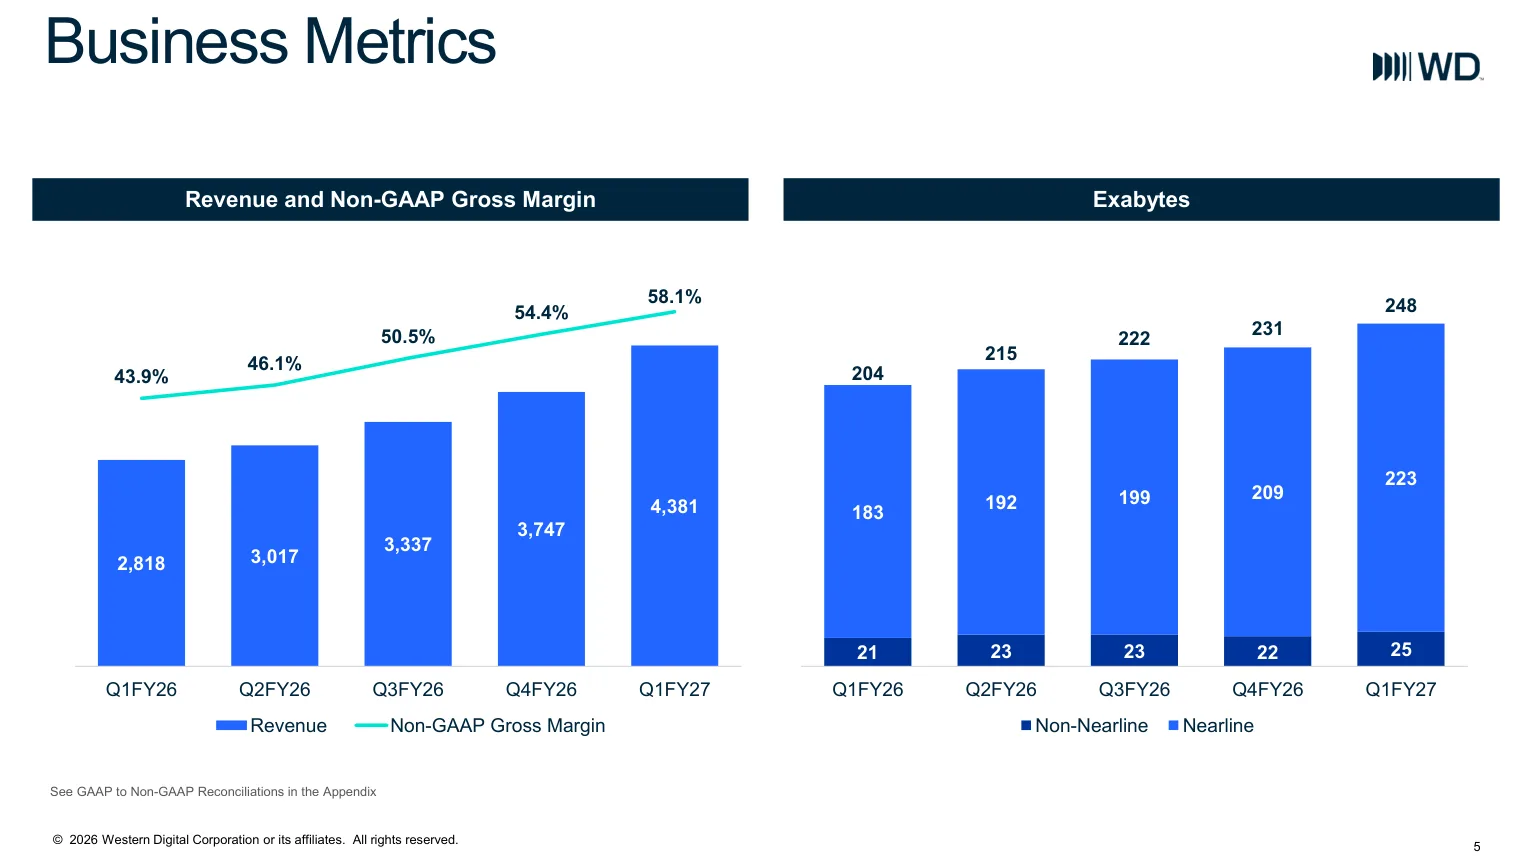
- Slide 5 of the first-quarter deck shows revenue rising from $2.82 billion in fiscal Q1 2026 to $4.38 billion and non-GAAP gross margin from 43.9% to 58.1%, while exabytes shipped rose from 204 to 248, of which 223 were nearline. Over five quarters the revenue bars grew 1.55 times and the exabyte bars 1.22 times; the gap between the two slopes is price. Slide 4 shows cloud at 88% to 89% of revenue in every one of those quarters.
- Slide 3 says “Revenue, non-GAAP gross margin, non-GAAP EPS above high end of guidance” and cites a “Strong free cash flow margin of 31.4%.” The large figures on the same slide label free cash flow as $1.6 billion and operating cash flow as $1.4 billion. The cash flow statement in the release shows the reverse: operating cash flow of $1.60 billion and free cash flow of $1.38 billion after $227 million of capital spending. The 31.4% margin matches $1.38 billion, so the slide’s two headline figures carry each other’s labels.
- Company disclosure (first-quarter call remarks): WD shipped 248 exabytes, up 22% year over year and 8% sequentially. Blended ASP per terabyte rose 28% year over year, up from mid-teens growth the prior quarter, with strength in nearline, non-nearline and parts of the consumer and client businesses. Some business is under long-term agreements, some of which are expiring and being renewed, and pricing is also strong for exabytes outside contracts.
- Management tied the price gains to total cost of ownership: higher-capacity drives put more data in each rack and use less power, so customers save even at a higher price per terabyte. In Q&A, CEO Irving Tan listed contractual price escalators in long-term agreements, repricing as contracts expire and better spot prices for nearline customers outside agreements in a supply-short market. CFO Kris Sennesael said year-over-year incremental gross margin was above 80%. The CEO’s release quote put it plainly: “Fiscal 2027 is off to a strong start, with results exceeding expectations, driven by robust customer demand and disciplined execution.”
- Own calculation (price vs volume): Splitting the $1.56 billion revenue increase between exabytes and revenue per terabyte, volume at last year’s unit price accounts for $607.8 million and the higher unit price for $955.2 million, or 61.1%. The same split gives price 25.8% of the increase in fiscal Q3 2026 and 50.8% in Q4. Holding price at last year’s level with costs unchanged, a 17% tax rate and 383 million diluted shares, first-quarter non-GAAP EPS would have been about $2.57 instead of $4.64.
A Long-Term Model Built on Stable Pricing
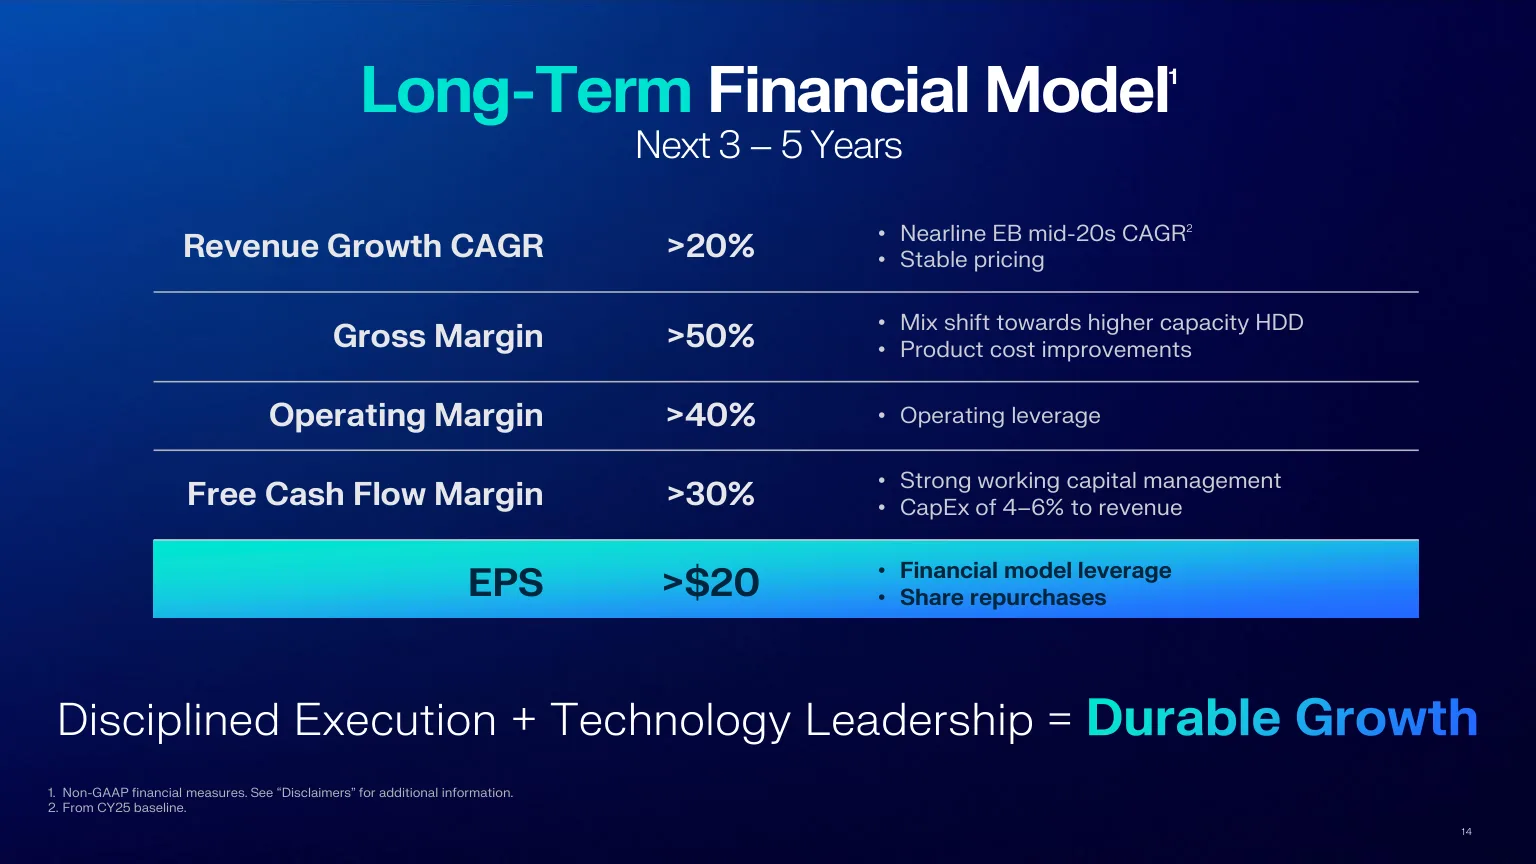
- Slide 14 of the August investor presentation repeats the model first shown on page 47 of the February Innovation Day deck. It targets revenue growth above 20% a year, supported by “Nearline EB mid-20s CAGR” and “Stable pricing,” along with gross margin above 50%, operating margin above 40%, free cash flow margin above 30%, capital spending of 4% to 6% of revenue and EPS above $20. A footnote sets calendar 2025 as the baseline. When the model came out, TTM non-GAAP EPS was $6.99. Slide 12 of the same deck shows fiscal 2024 to 2026 revenue rising from $6.3 billion to $9.5 billion and $12.9 billion, a 43% annual rate, with non-GAAP operating margin rising from 5% to 24% and 37%.
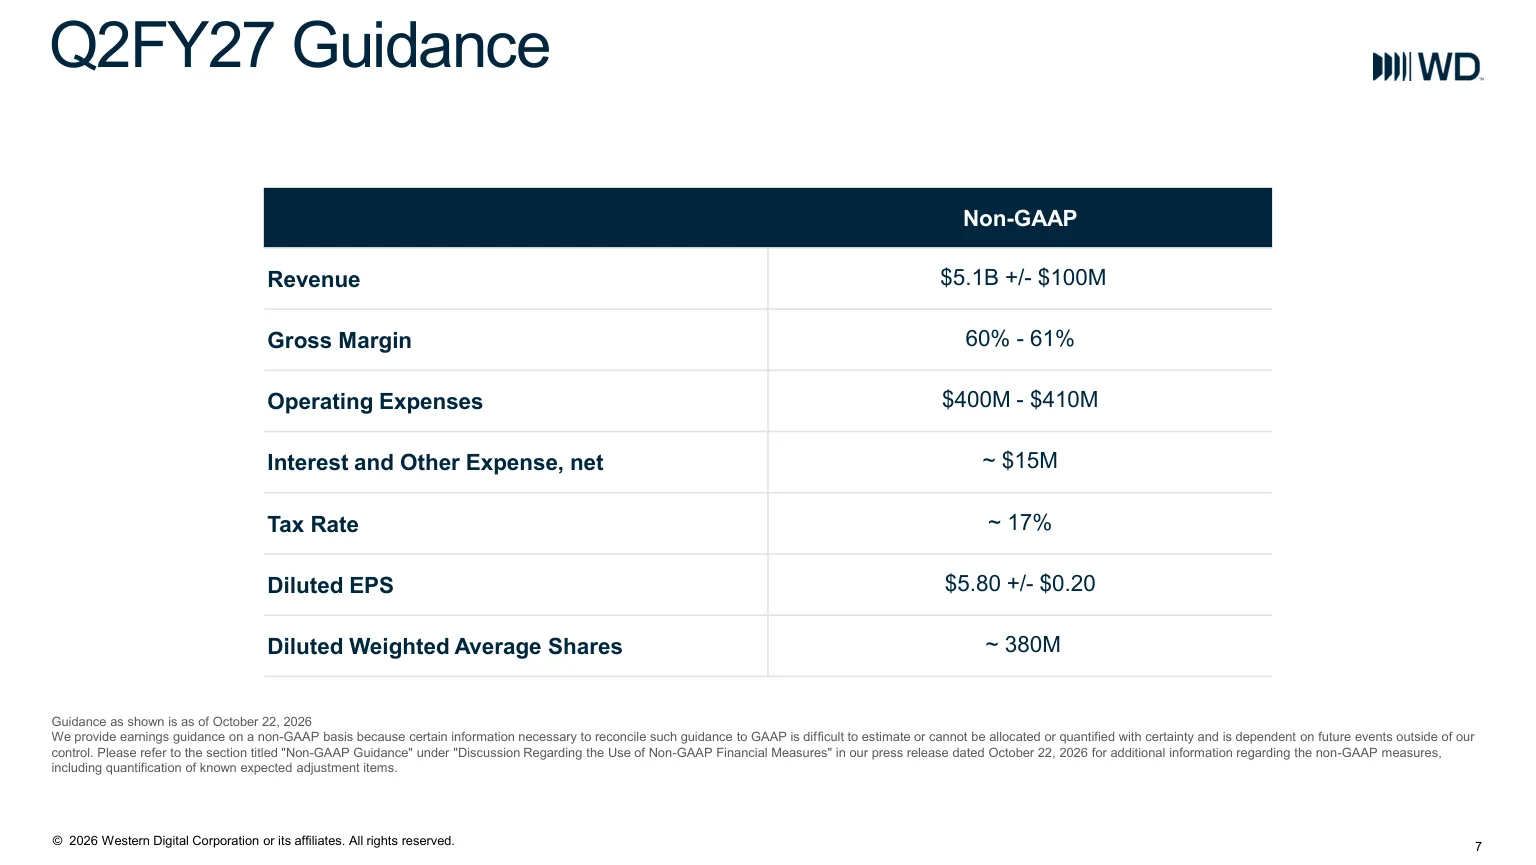
- Slide 7 of the October deck guides December-quarter revenue to $5.1 billion plus or minus $100 million, non-GAAP gross margin of 60% to 61%, operating expenses of $400 million to $410 million, a tax rate of about 17% and EPS of $5.80 plus or minus $0.20 on about 380 million diluted shares. The revenue midpoint is +16.4% above the first quarter and +69.0% above a year earlier, and EPS is +25.0% above the first quarter.
- Company disclosure (first-quarter call remarks): Demand remains robust, customer engagement is deepening and visibility keeps improving. Management sees the first quarter as the low point for exabyte growth, which should accelerate through the rest of the fiscal year. Capital spending should average 4% to 6% of revenue over five years but run slightly above that range for the next two, and areal density gains from head and media technology will grow exabytes without adding unit capacity.
- Own calculation (calendar revenue vs the model): Calendar 2025 revenue was $10.73 billion. Adding the December-quarter guide midpoint to the first three quarters of 2026 gives $16.57 billion, up 54.3%. Nearline exabytes over the latest four quarters were 823 against 690 in calendar 2025, up 19.3%, below the model’s mid-20s rate, so almost all of the gap between the model’s 20%-plus revenue growth and the actual 54.3% is price.
The Bull and Bear Case for WD Shares
- The bull case rests on results running ahead of the company’s own targets. In all six post-spin quarters revenue beat the guidance midpoint by 2.7% to 6.9%, and gross margin landed 0.3 to 2.5 points above the top of the guided range. Management says it has visibility into demand from its top seven customers through 2030, and first-quarter free cash flow was $1.38 billion, 31.4% of revenue.
- The bear case rests on where the profit comes from. Price explained 61.1% of first-quarter revenue growth while the company’s model assumes stable pricing. Analysts asked about capacity additions by the smallest competitor, rumors of industry consolidation and the timing of neo-cloud spending, and management said rising DRAM and NAND input costs will keep near-term cost-per-terabyte declines below 10% a year. In the first quarter WD bought back 2.0 million shares and issued 14.0 million to settle convertible notes.
From Sandisk Spin-Off to a Pure HDD Company
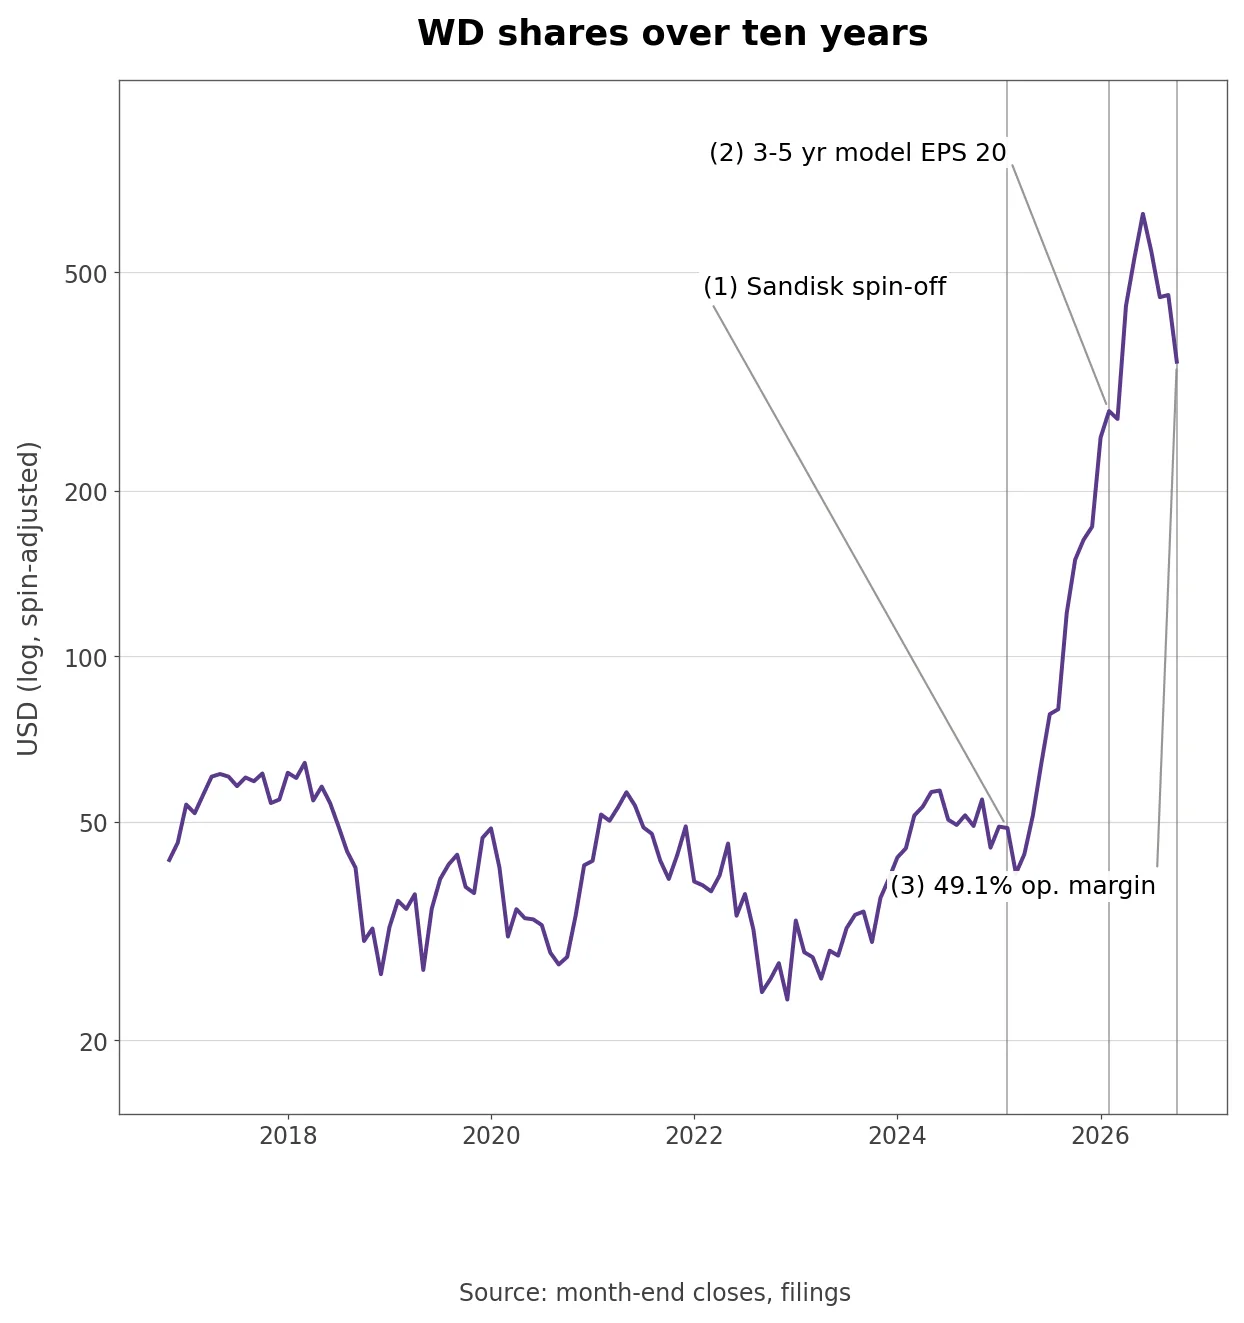
- The past two years changed the shape of the company. On February 21, 2025 the flash business became Sandisk, and WD kept 28.8 million Sandisk shares. According to the 10-K, it used 21.3 million of them in June 2025 to cut about $800 million of term loan debt, 5.8 million in February 2026 to retire notes, and the last 1.7 million in fiscal Q4 2026 to acquire 4.8 million of its own shares. The 10-K states: “As of July 3, 2026, we no longer held shares of Sandisk common stock.”
- Those disposals inflated GAAP earnings. The first-quarter deck’s reconciliation shows gains on the retained Sandisk interest of $611 million, $1.10 billion, $2.73 billion and $2.05 billion across the four quarters of fiscal 2026, and none in fiscal Q1 2027. GAAP EPS was $8.21 in the fourth quarter but $4.63 in the first, almost equal to non-GAAP EPS of $4.64. In February 2026 the remaining preferred shares converted into 7 million common shares.
- On spin- and dividend-adjusted year-end closes, the old WD swung with memory and storage cycles: the stock moved -51.6% in 2022, +66.0% in 2023, +13.9% in 2024 and +283.8% in 2025. From $63.99 at the end of June 2025 it reached $638.72 at the end of June 2026, 9.98 times higher.
How Much of the Growth Is Price?
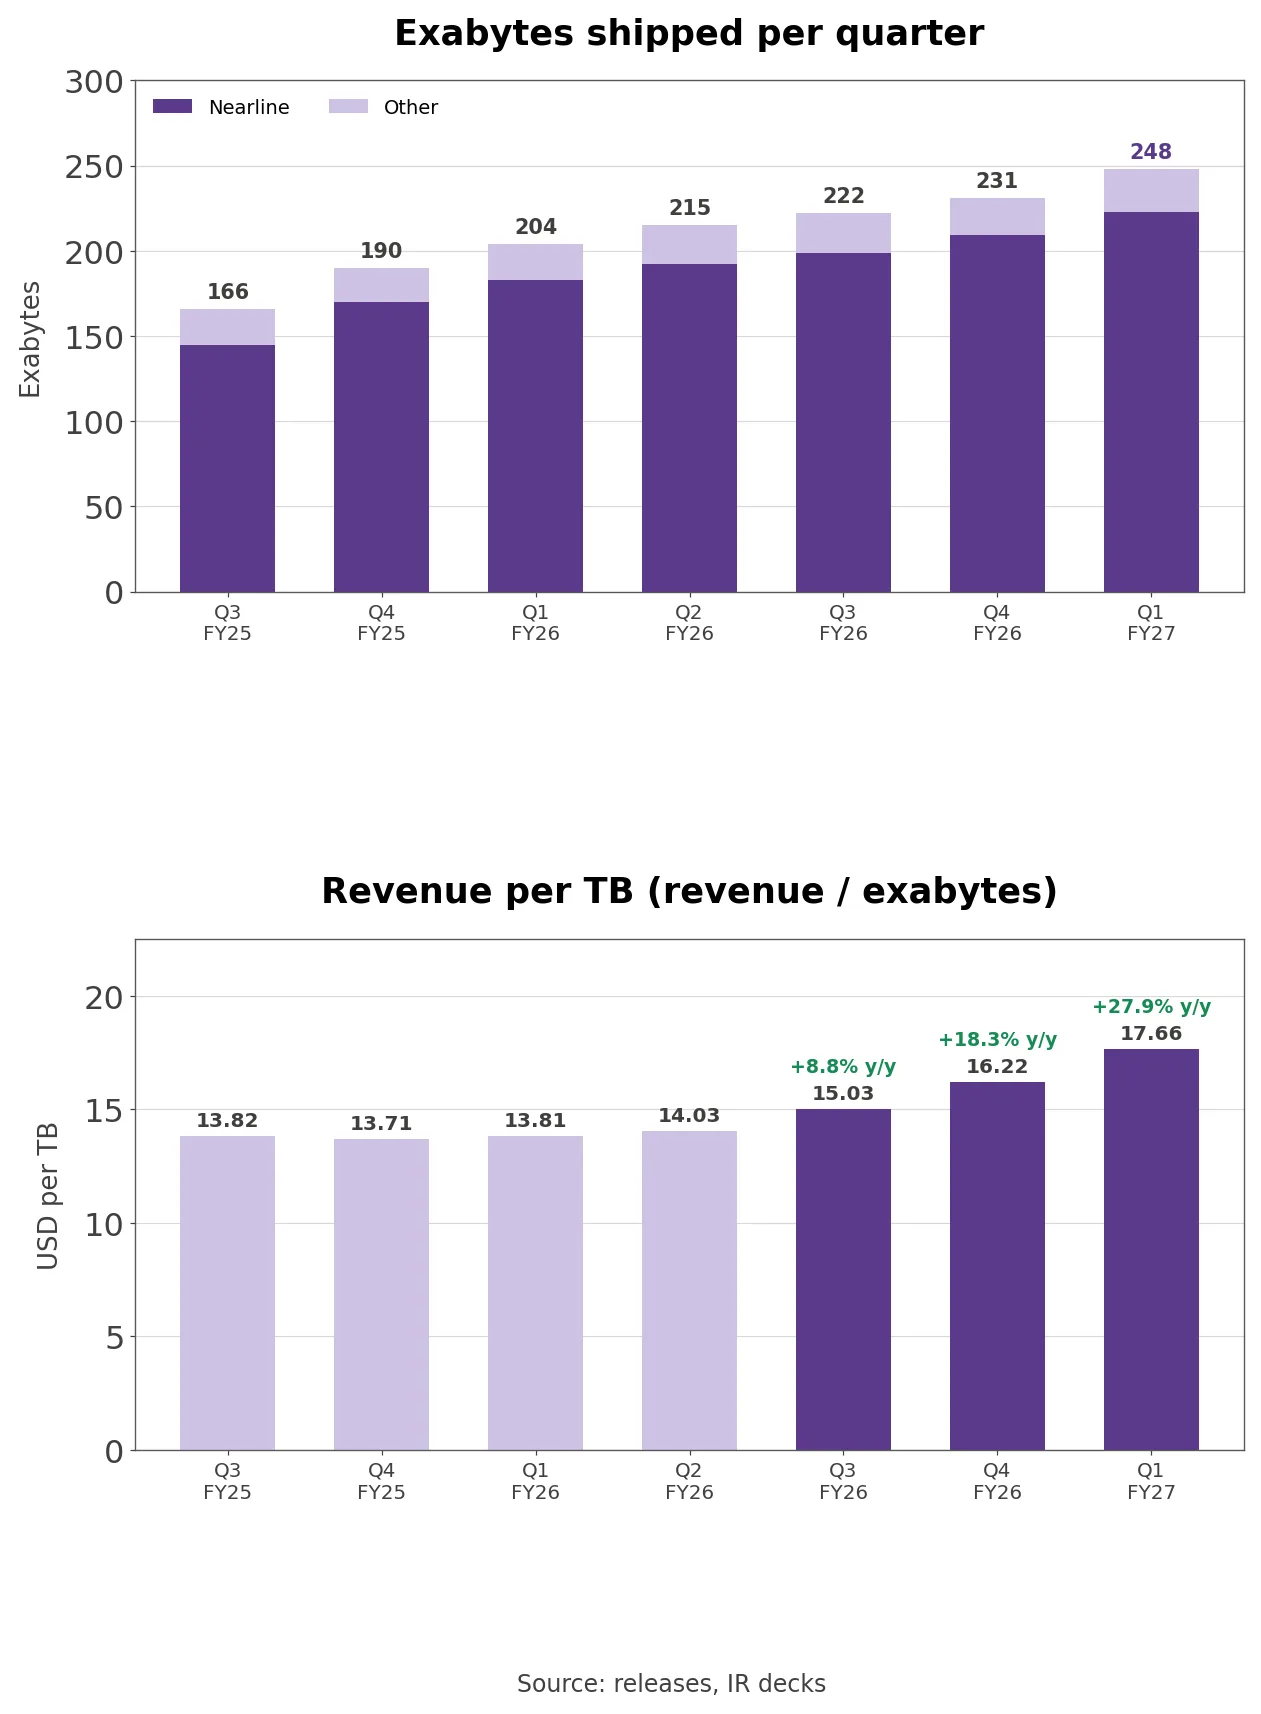
- Across seven post-spin quarters, revenue per terabyte falls into two phases. It was nearly flat at $13.82 in fiscal Q3 2025, $13.71 in Q4 and $13.81 in fiscal Q1 2026, then moved through $14.03 in Q2 to $15.03 in Q3, $16.22 in Q4 and $17.66 in fiscal Q1 2027. Year-over-year gains were +8.8%, +18.3% and +27.9%, larger each quarter.
- Exabytes shipped rose from 166 to 248 over the same stretch. Growth was 33.7% in fiscal Q3 2026, 21.6% in Q4 and 21.6% in fiscal Q1 2027, with nearline at 21.9%. As volume growth slowed, price growth sped up, and first-quarter revenue growth reached 55%.
- Management called the first quarter the trough for exabyte growth. The new ePMR platform with up to 40TB should account for about 30% of nearline shipments in the December quarter and 50% in the March quarter. First-generation HAMR drives are due to finish qualification with two hyperscale customers in the first quarter of 2027 and to begin volume shipments in the first half of the year.
Six Straight Beats and the EPS Goal
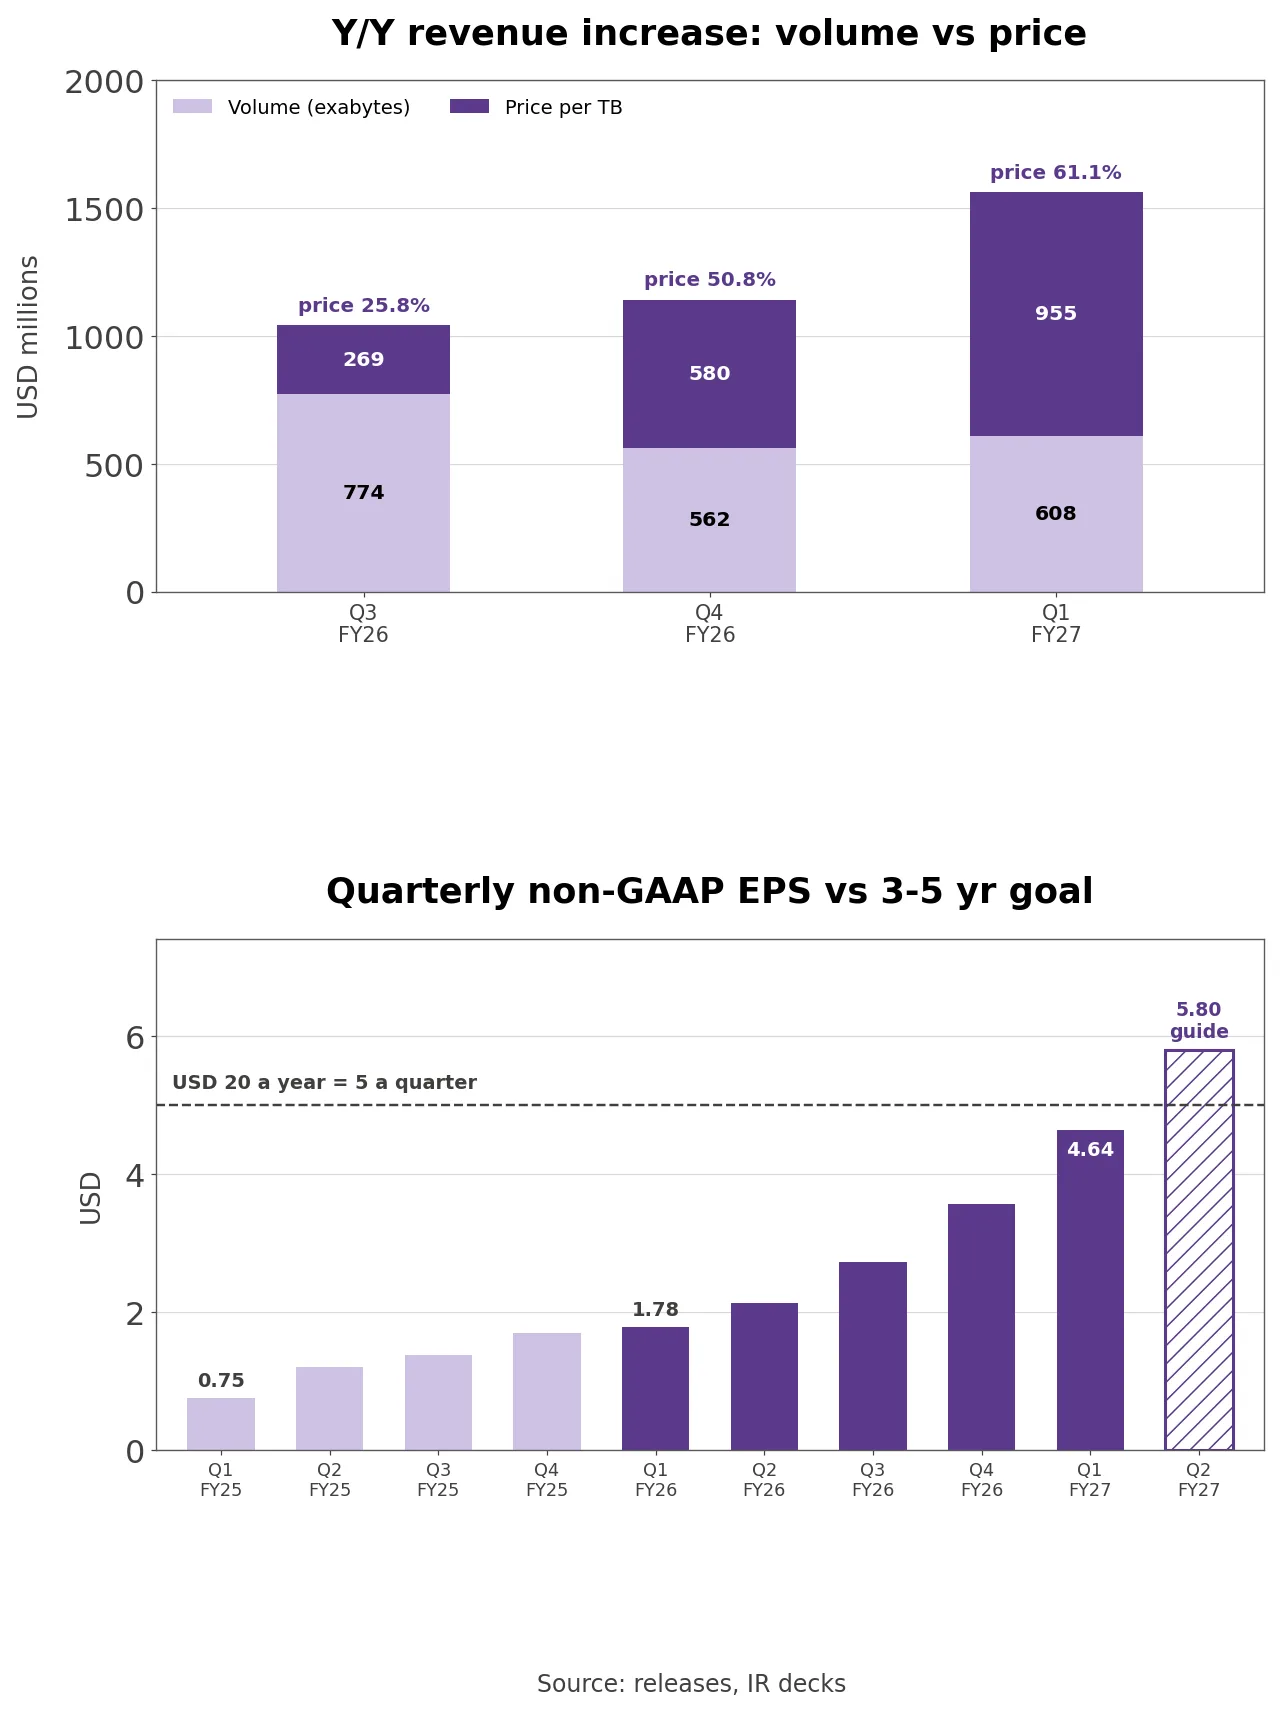
- Against the guidance midpoint, actual results came in higher in all six post-spin quarters. EPS beat by 17.2% in fiscal Q4 2025, 15.6% in fiscal Q1 2026, 13.3% in Q2, 18.3% in Q3, 9.5% in Q4 and 16.0% in fiscal Q1 2027. EPS beats ran larger than revenue beats because gross margin cleared the top of the guided range every time.
- Quarterly non-GAAP EPS rose from $0.75 in fiscal Q1 2025 to $4.64 in fiscal Q1 2027, 6.2 times higher. The $5 line, the quarterly equivalent of $20 a year, is first crossed by the December-quarter guide of $5.80.
- Outside view (consensus estimates, market data): The average non-GAAP EPS estimate for fiscal 2027, ending June 2027, is $24.85, up 36.3% from $18.23 ninety days earlier, and the fiscal 2028 estimate rose 45.7% to $39.55 from $27.15. Fiscal 2028 estimates range from $21.95 to $57.04, 2.6 times apart.
- The width of that range reads like a disagreement about pricing. The low estimate sits near the company’s $20 model, while the high estimate is closer to a world in which this year’s price gains continue.
How Western Digital Makes Money
- WD makes high-capacity hard drives for data centers and sells them mostly to hyperscale cloud operators. The August deck cites IDC that “80% of storage within the cloud is on HDDs” and says about 90% of WD revenue comes from the cloud. Data that is kept for a long time and reused, such as AI training sets and inference logs, is where hard drives win on cost. The 10-Q splits first-quarter revenue into cloud at $3.87 billion (88.3% of the total, +54.1%), client at $320 million (+119.2%) and consumer at $193 million (+19.1%). By ship-to region, the Americas rose 89.2% to $2.08 billion and supplied 62.8% of the year’s revenue increase, Asia rose 45.4% to $1.71 billion, and Europe, the Middle East and Africa rose 9.0% to $592 million.
- The customer base is concentrated but widening. The top 10 customers made up 64% of first-quarter revenue, down from 73% a year earlier, and two customers each exceeded 10% of revenue, at 14% and 13%, compared with four a year earlier. Management said demand is broadening to frontier AI labs, neo-cloud players and hybrid cloud OEMs. The 10-K names Seagate, Toshiba and NAND flash suppliers as competitors.
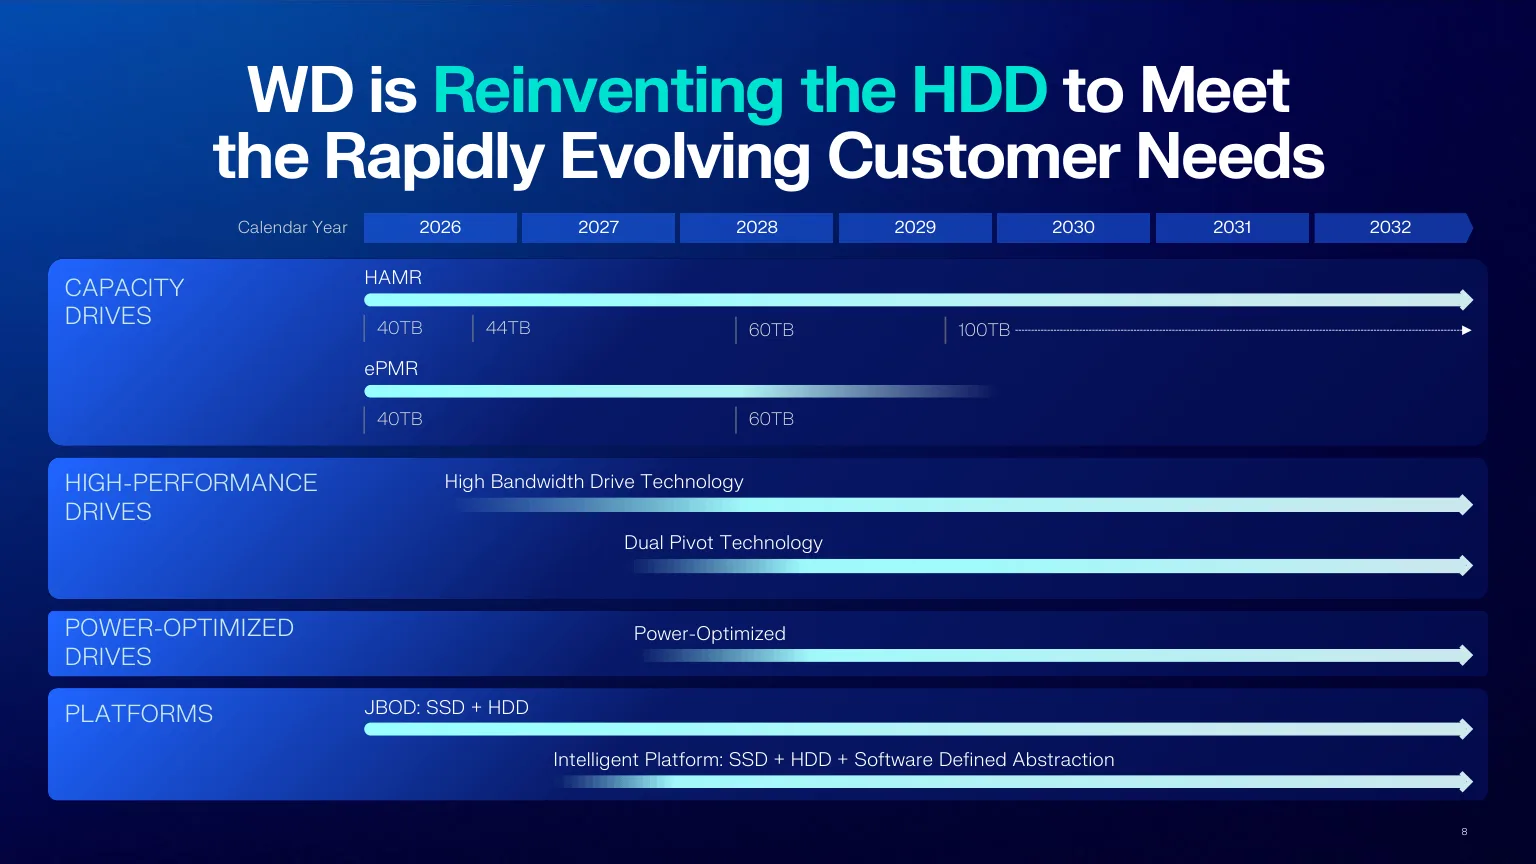
- Slide 8 of the August deck lays out the product plan by calendar year. Reading the slide’s markers, ePMR moves from 40TB in 2026 to 60TB in 2028, while HAMR, which heats the recording medium with a laser to raise density, goes from 40TB and 44TB in 2026 to 60TB in 2028 and 100TB around 2029. Slide 9 shows average nearline capacity rising from 23TB through 32TB, 40TB and 44TB to more than 100TB, and slide 10 adds “20% capacity increase via software” through UltraSMR. Second-generation HAMR qualification starts in the second half of 2027 with 5TB per platter on an 11-disk platform.
- Capacity per drive is what links this plan to pricing. More terabytes per drive lets WD grow exabytes without new factories or assembly lines, and lets customers store more data in the same rack and power budget. Management says vertical integration in heads and media is why it can raise density faster than rivals that rely on third-party components. Slide 11’s footprint includes wafer fabs in San Jose and Fremont, head plants in the Philippines and Thailand, media plants in Malaysia and Shenzhen, and drive assembly in Prachinburi and Bang Pa-in, Thailand.
How WD Compares With Three Storage Peers
- The peers are Seagate, the other hard drive maker; Sandisk, the NAND company WD spun off in 2025; and Micron, the memory maker. All four sell into AI data center storage demand, but only WD and Seagate make hard drives.
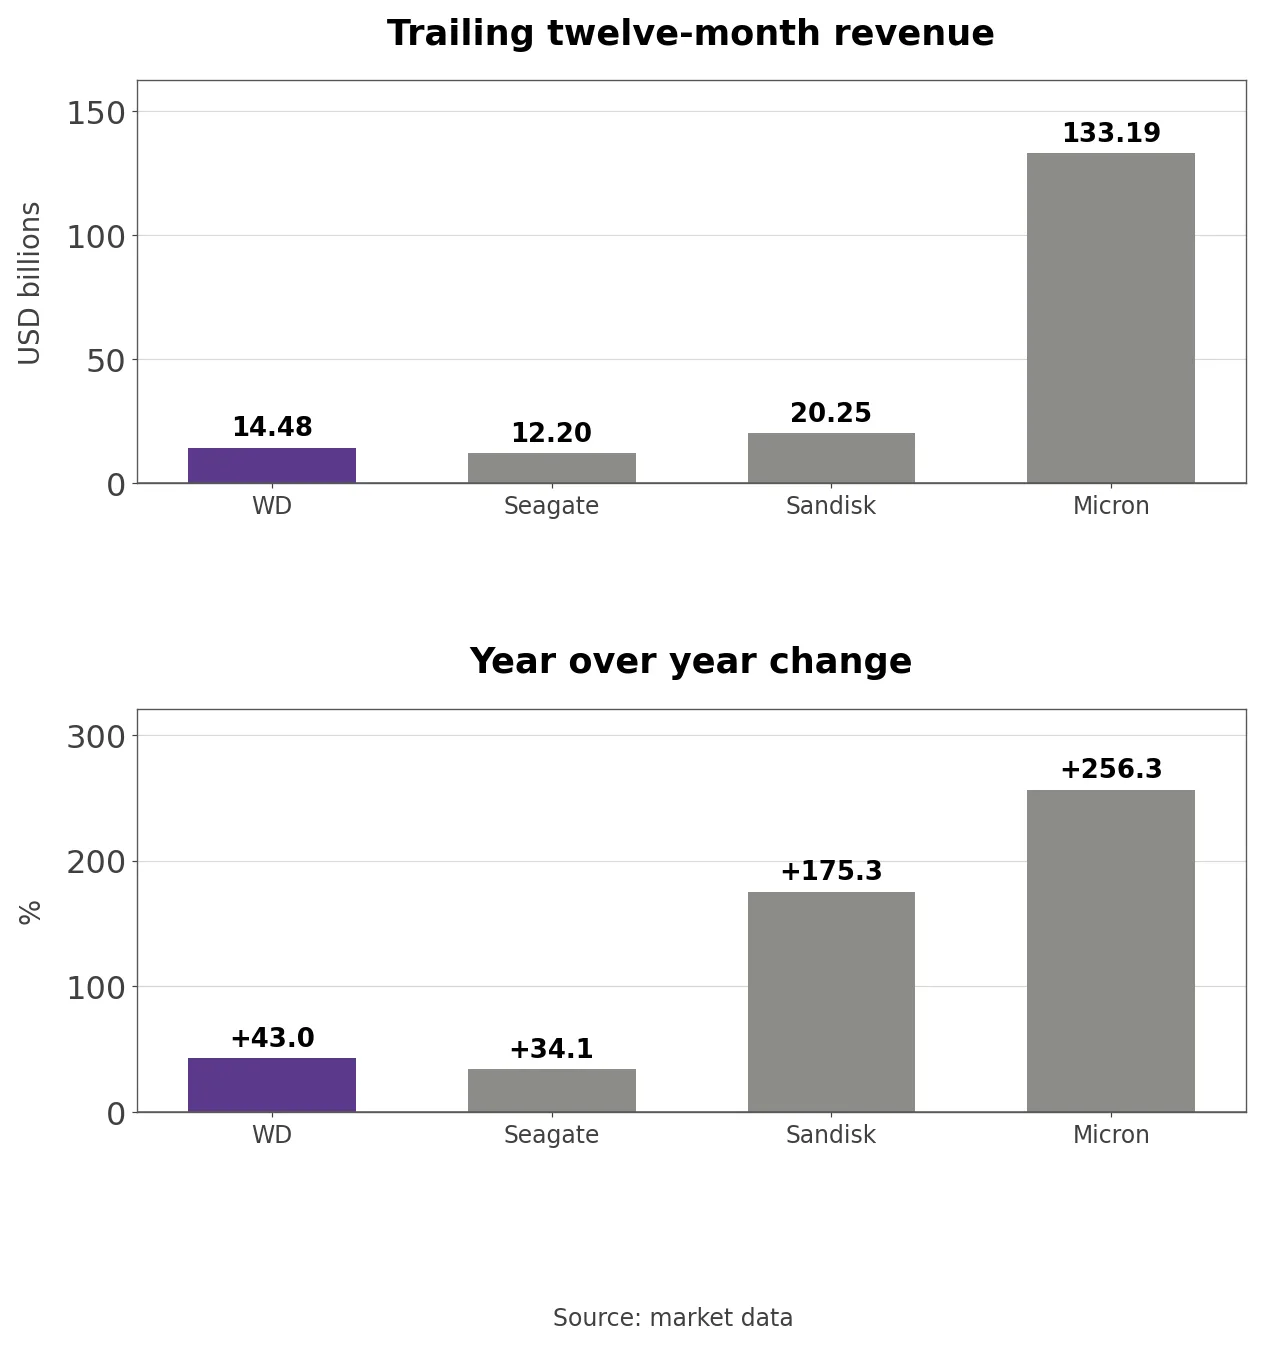
- WD’s TTM revenue of $14.48 billion is larger than Seagate’s $12.20 billion and smaller than Sandisk’s $20.25 billion and Micron’s $133.19 billion. Its growth of +43.0% is close to Seagate’s +34.1%, while Sandisk at +175.3% and Micron at +256.3% ride a far sharper memory price cycle.
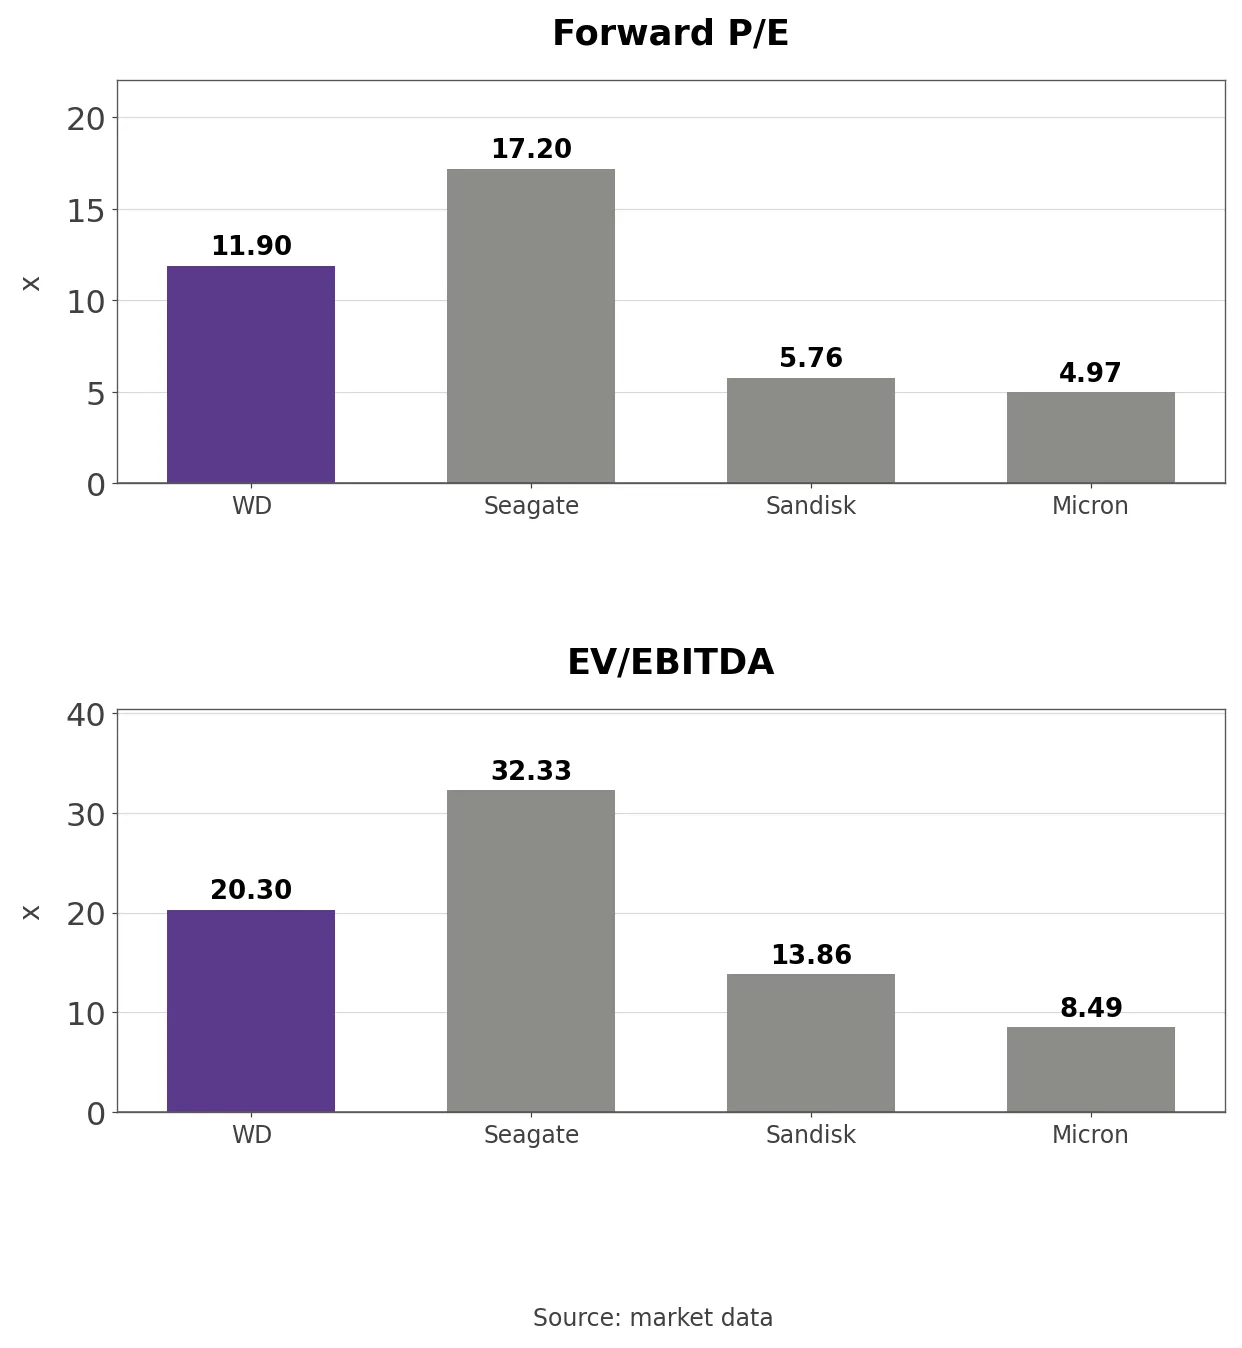
- WD trades at 11.90 times forward earnings, below Seagate at 17.20 and above Sandisk at 5.76 and Micron at 4.97. EV/EBITDA follows the same order: WD 20.30, Seagate 32.33, Sandisk 13.86 and Micron 8.49. From the end of June, WD fell -46.2%, Seagate -34.7%, Sandisk -45.6% and Micron -24.0%, so WD dropped more than its direct HDD rival.
- WD’s return on invested capital (ROIC) of 64.19% is below Seagate’s 85.92%, Micron’s 93.42% and Sandisk’s 102.23%, while its free cash flow yield of 3.33% is above Seagate’s 2.17%. In the first quarter WD returned $1.06 billion, $1.00 billion in buybacks and $56 million in dividends, or 76.8% of free cash flow, raised the quarterly dividend 17% to $0.175 and has $2.26 billion left on its authorization.
- The share count still rose. Per the 10-Q, settling convertible notes cost a $7.25 billion conversion premium paid in 14.0 million common shares, while buybacks retired 2.0 million. Cover-page shares rose from 339.0 million in January to 374.3 million in October, +10.4% in nine months. Remaining convertible principal is $141 million, and cash of $1.31 billion less $791 million of debt leaves net cash of $523 million.
P/E and Price-to-Sales Since the Spin-Off
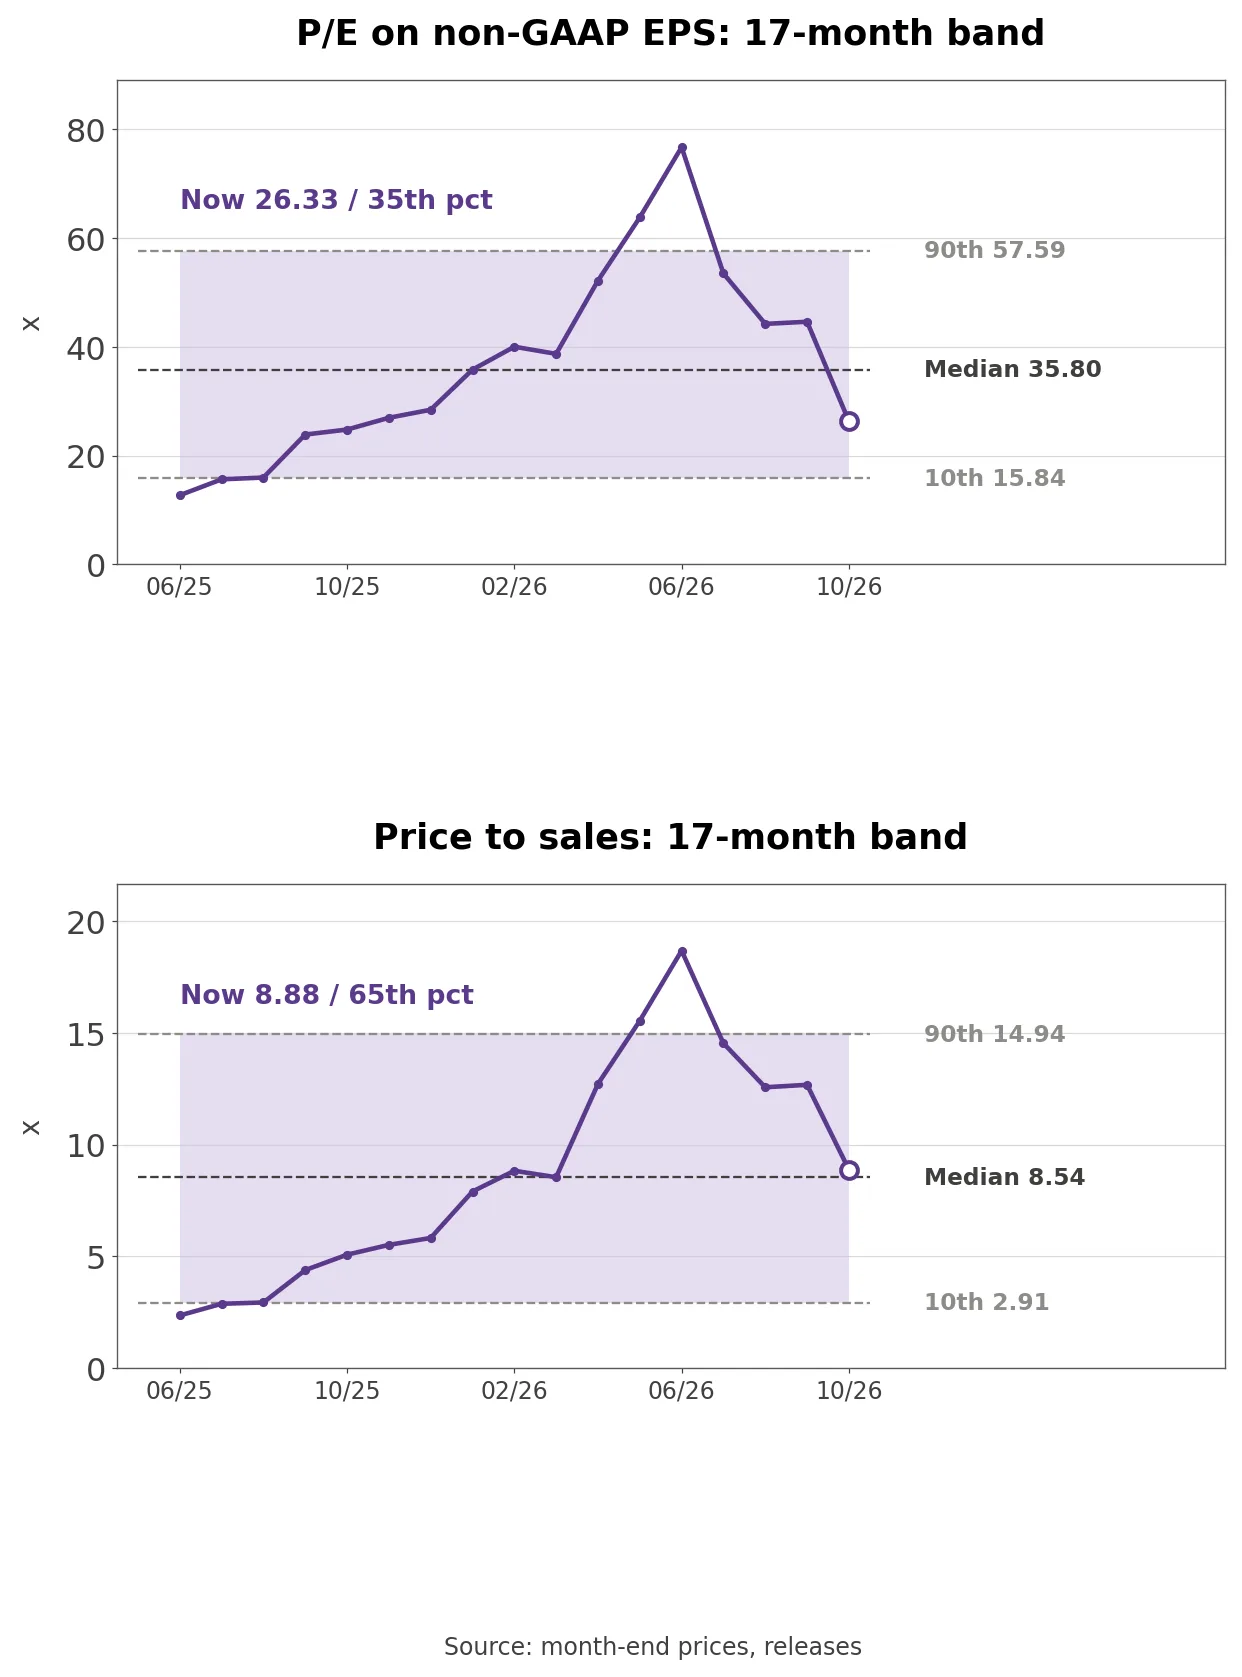
- The P/E on TTM non-GAAP EPS is 26.33, in the 35th percentile of the 17 months since June 2025, when the first four post-spin quarters became available. The median is 35.80, the low 12.72 in June 2025 and the high 76.68 in June 2026. Price-to-sales is 8.88, in the 65th percentile against a median of 8.54. Seventeen months is more a path than a distribution, so the direction of the multiple matters more than its rank.
- June’s 76.68 was the point where the stock ran ahead of earnings. Since then TTM EPS rose from $8.33 to $13.05 while the shares fell, cutting the multiple to a third. On the December-quarter guide annualized to $23.20 the stock trades at 14.81 times, on the fiscal 2027 estimate of $24.85 at 13.83 and on the fiscal 2028 estimate of $39.55 at 8.69. The GAAP P/E of 13.34 includes $6.50 billion of Sandisk gains from fiscal 2026 and no longer fits a company that holds no Sandisk stock.
Three Conditions That Move the Stock
- Revenue per terabyte was $17.66 in the first quarter, +27.9% year over year. If long-term agreement repricing and strong spot prices keep price growth above exabyte growth, earnings stay above the company’s model; if competitor capacity or slower neo-cloud spending flattens unit prices, revenue growth falls back toward exabyte growth of about 20%.
- Exabyte shipments were 248 in the first quarter, up 21.6%. If 40TB ePMR reaches half of nearline shipments in the March quarter and HAMR enters volume production in the first half of 2027, pushing growth above the mid-20s, revenue can grow as the model says even if prices stabilize; if HAMR qualification slips, volume and price could weaken together.
- Non-GAAP gross margin was 58.1% in the first quarter and the December guide range is 60% to 61%. If value engineering absorbs higher memory input costs and incremental margin stays near 75%, gross margin in the 60s becomes the base; if input costs rise faster than prices, the run of six quarters above the top of the guided range ends.
What to Watch in the January Report
- The next numbers are December-quarter price-per-terabyte growth, exabyte growth and the March-quarter guide. Management called the first quarter the trough for exabyte growth and expects HAMR qualification to finish in the first quarter of 2027.
- One question remains open. The three-to-five-year model holds prices stable and relies on exabytes for 20%-plus growth, yet the latest quarters lean on price far more than the model does. If prices flatten in the next round of long-term agreements, can the extra exabytes from HAMR alone keep quarterly EPS above $5?
Related Analysis
- TSMC (TSM) Stock: 60% Margins and Guidance It Keeps Beating: an AI hardware supplier with its own run of guidance beats, useful for comparing how two companies price scarce capacity.
- NVIDIA (NVDA) Stock Analysis: Guarantees and Cash Flow: the AI accelerator leader whose data center buildout drives the storage demand behind WD’s cloud revenue.
- Applied Materials (AMAT) Stock Analysis: Guidance Record: another hardware company with consecutive beats against its own guidance, a direct comparison with WD’s six straight beats.